-
Notifications
You must be signed in to change notification settings - Fork 5
Home
bModelTest is a BEAST 2 package, so you need to get BEAST 2 first.
To run a bModelTest model analysis, you need the bModelTest package. The easiest way to do this is by starting BEAUti, and open the package manager using the File/Mange packages menu. A dialog pops up that looks like this:
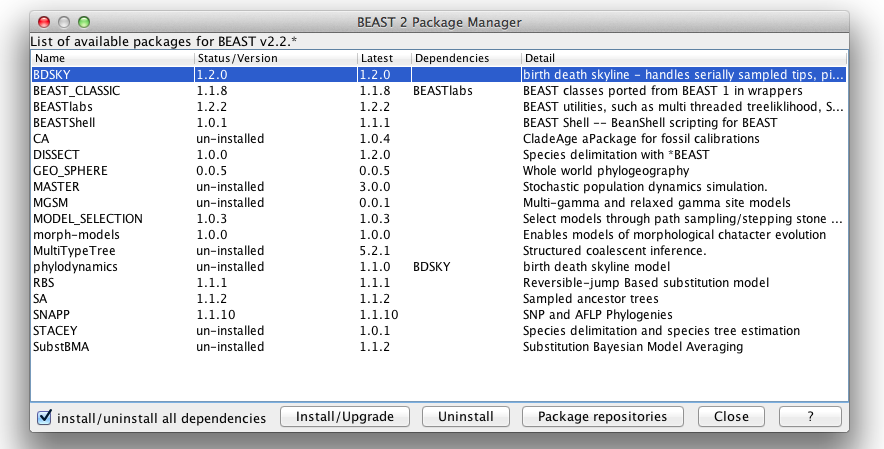
Select the bModelTest package and click the Install/Upgrade button. Restart BEAUti in order for the bModelTest model to be available.
Start BEAUti, load an alignment as per usual. Now, when you go to the Site model panel, there is a choice of site models shown in the combobox at the top of the panel:
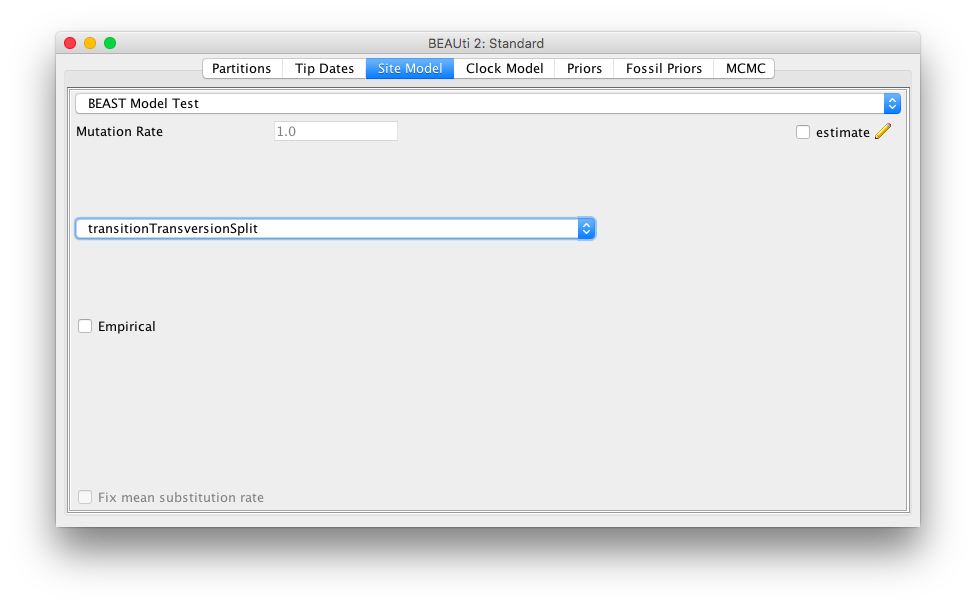
Select the BEAST Model Test model for the bModelTest model.
There are two ways you can use bModelTest
-
by model selection: first run an analysis with bModelTest and select the model that has most posterior support. Run the final analysis with the site model (say HKY + 4G + estimated frequencies) that has most posterior support.
-
by model averaging: you just run the analysis with bModelTest as site model and the BEAST analysis averages over all models, and use this as you analysis.
The latter is recommended, and requires fewer computational effort.
To analyse the results of a BEAST run with bModelTest, you can start Tracer and find the following items:
-
BMT_ModelInidicator is the index of the substitution model as listed in the appendix of the paper.
-
substmodel is the model represented as a 6-digit number, where the position of the digit refers to rates ac, ag, at, cg, ct and gt respectively, and equal digits indicates that rates are shared, so 111111 is Jukes Cantor (if frequencies are kept equal), 121121 is HKY, 123456 is GTR etc.
-
rateAC … rateGT are the rates according to the model. ESSs should be good for these rates, but if you plot joint-marginals of pairs you may find high correlation between some of these rates.
-
BMT_Rates.1 to 6 are the rates used to build up the rate matrix. If only low parameter models are samples, the higher rates will be sampled very infrequently, and you should expect low ESSs for them. Correlation between pairs of rates should be low.
-
BM_gammaShape is the gamma shape parameter as it is being sampled. For parts of the chain that gamma rate heterogeneity is switched off, the parameter will not be sampled, and the trace will show periods where the parameter is stuck.
-
hasGammaRates indicates whether gamma rate heterogeneity it used (1) or not used (0). The mean can be interpreted as the proportion of time that gamma rate heterogeneity is switched on.
-
ActiveGammaShape is the gamma shape parameter when it is sampled, but it is zero when it it not sampled. To get the estimate of the mean of the shape parameter, divide the mean ActiveGammaShape by the mean of hasGammaRates.
-
BMT_ProportionInvariant, hasInvariantSites and ActivePropInvariant are the value for proportion invariant similar to BMG_gammaShape, hasGammaRates and ActiveGammaShape respectively.
-
hasEqualFreqs indicates whether equal frequencies are used and the mean can be interpreted as the proportion of time that equal frequencies is used.
To visualise the distribution over substitution models, you can use the bModelTestAnalyser. Start the AppStore application, and launch bModelTestAnalyser

A dialog pops up where you can specify the trace log file and set some parameters:
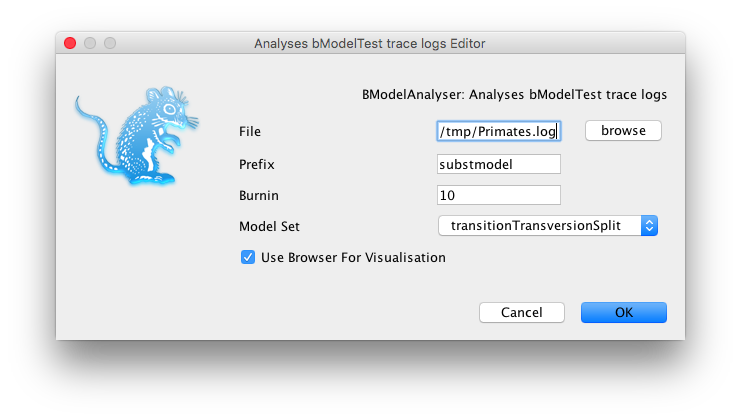
After you click OK, a window pops up listing some statistics:
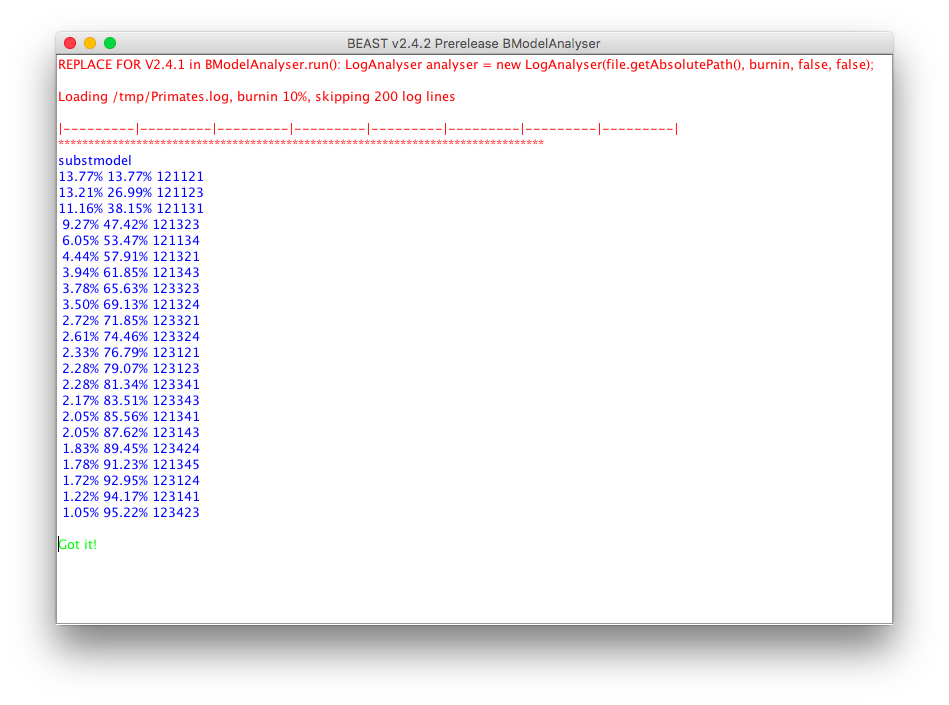
and after a while, your web-browser should show a new page (one for each partition that uses bModelTest) that looks something like this:
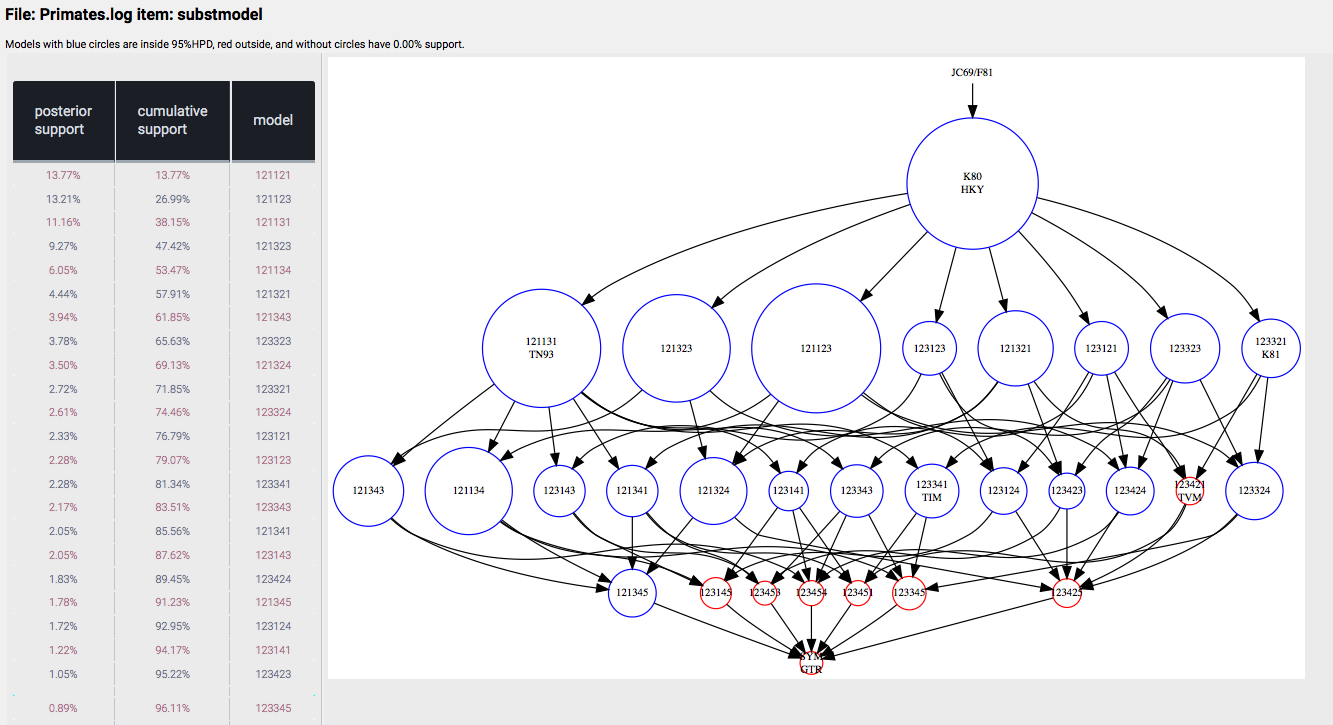
You can uncheck the "Use Browser for Visualisation" flag in the bModelTestAnalyser dialog and a stand alone window pops up with the graphic.
When you see low ESSs in Tracer usually this means you need to run the analysis longer. However, with bModelTest some parameters are not sampled very often, for example when there is a lot of support for HKY and almost nothing for GTR the sixth rate parameter is hardly ever sampled and ESSs will be low and may require excessively long MCMC runs to get ESSs of 200 or over.
The sixth rate is only sampled when the GTR model is used — all other substitution models use fewer parameters. So if the data does not support the GTR model, the sixth rate parameter will be sampled very infrequently, resulting in low ESS values of the sixth rate parameter. A better indicator of mixing is to have a look at the log entries for the realised rates: rateAC, rateAG, rateAT, rateCG, rateCT, and rateGT for each partition. These all should have good ESS values, even though the sixth rate parameter does not.
If only the hasEqualFreqs parameter has low ESS, you might want to increase the weight of the BitFlipOperator that operates on this parameter. By default, the weight is just 0.1, so increasing to 1.0 should help. You can edit the weight in BEAUti by first choosing the Show/Operators menu, and in the Operators panel set the weight for the operator with BMT_FreqsFlipOperator.s.s:XYZ. Alternatively, you can edit the weight in the XML on the element with id=“BMT_FreqsFlipOperator.s:XYZ”.
If you have questions, please use the BEAST users mailing list (in google groups or mark mail).
A more detailed description of the method can be found in Remco Bouckaert and Alexei Drummong. "bModelTest: Bayesian phylogenetic site model averaging and model comparison", BioArxiv, 2015. http://www.biorxiv.org/content/early/2015/06/11/020792