FordFulkerson GUI
[email protected] https://github.com/MitchellGray100/Chess
JavaFX Ford-Fulkerson Calculator. Inspired by CS 4820.
As a personal project, I created a representation of a Ford-Fulkerson Calculator in Java using JavaFX.
The calculator lets the user place nodes and connect each node with edges. The nodes automatically number themselves from:
s->1->2->n...->t.
The capacities of every edge can be changed. Nodes and Edges can be removed. Nodes automatically decrement, if needed, to keep the numbered
structured. Edges automatically remove themselves from removed nodes. All edges and capacities can be seen by clicking on Nodes.
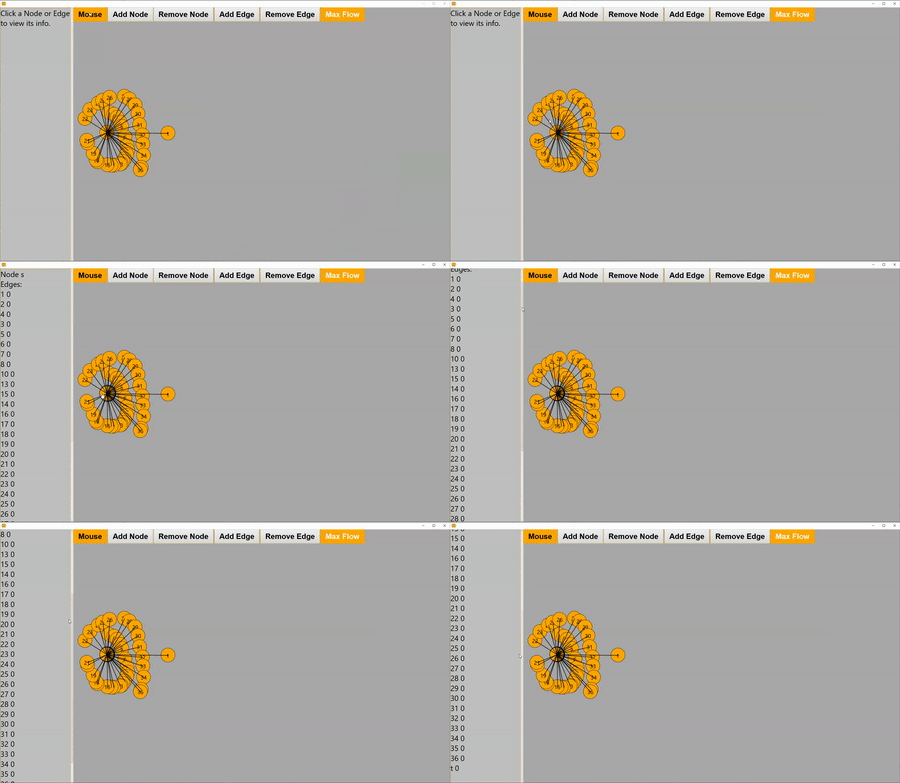
The left panel is scrollable incase there is a large quantity of edges coming out of a node. Max Flow can be checked with the push of a button.
To Play, just download the .exe file: https://github.com/MitchellGray100/FordFulkerson/raw/main/FordFulkerson.exe.
If you gen a JNI error, make sure to download java.
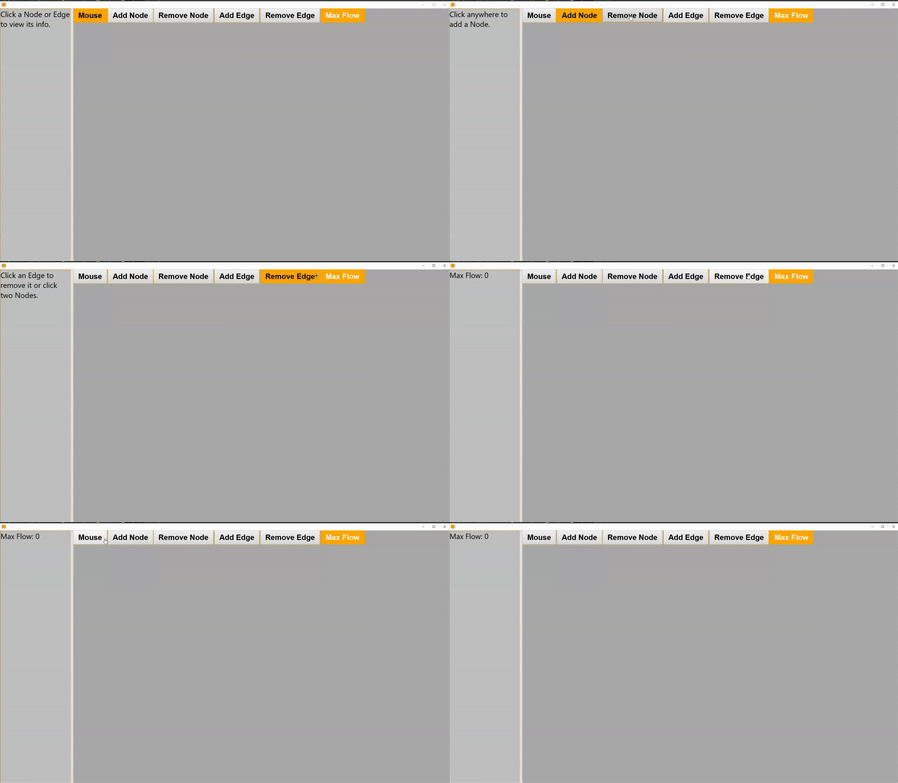
Showing off how the buttons interact when clicked and hovered over. Buttons become orange when clicked and display help info in the top left.
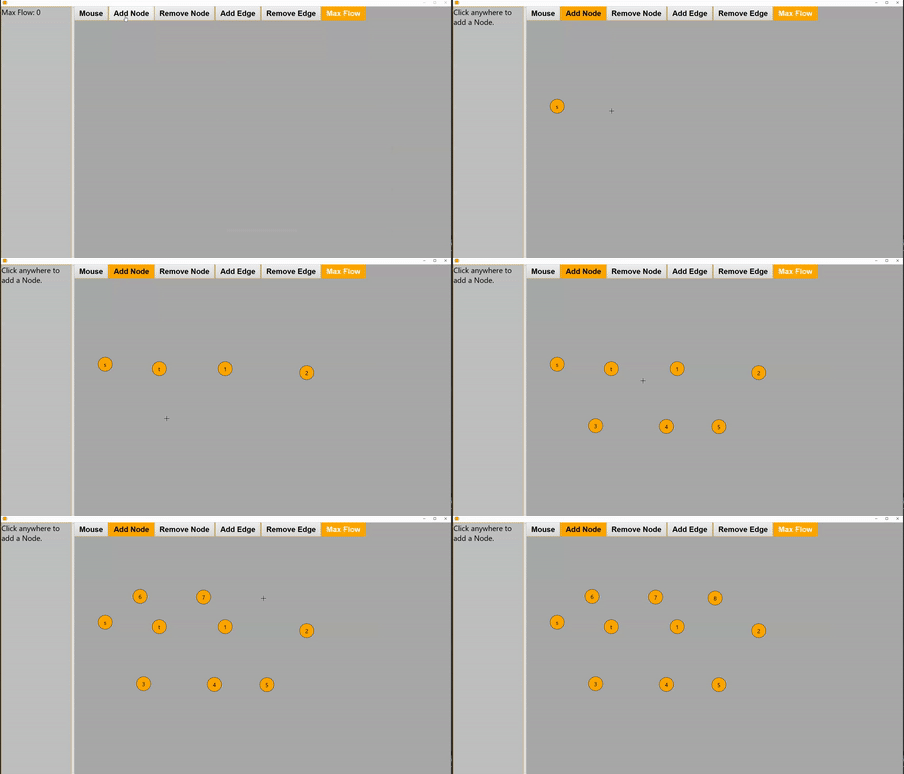
Shows Nodes being added into the program. Number Ordering of the Nodes increases automatically and shows the first and last node as 's' and 't'.
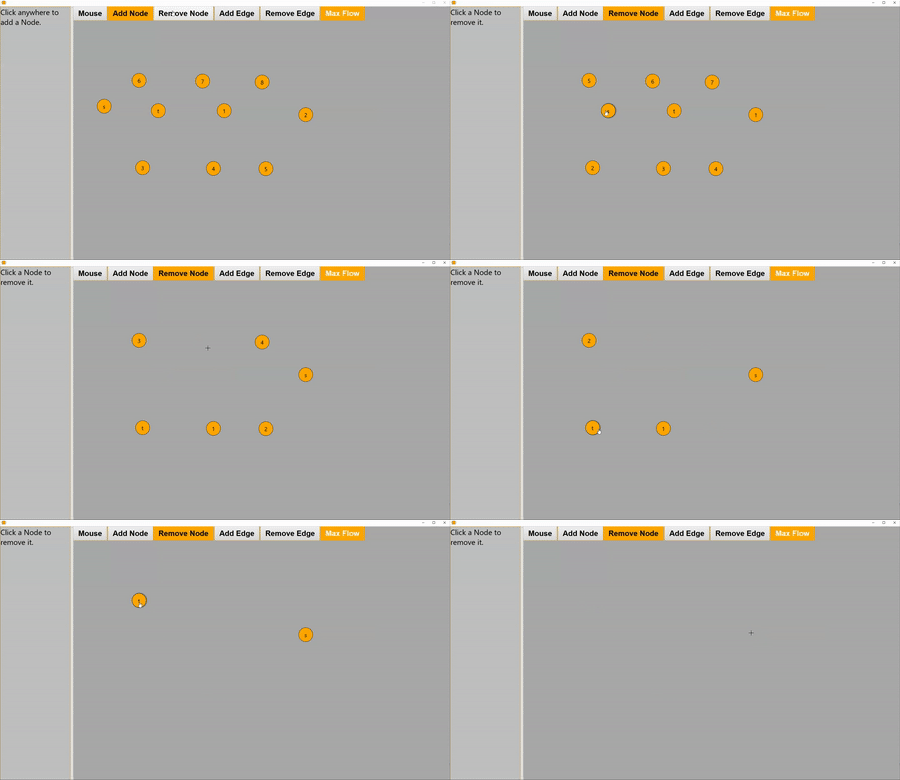
Shows Nodes being removed from the program. Number Ordering of the Nodes is changed automatically.
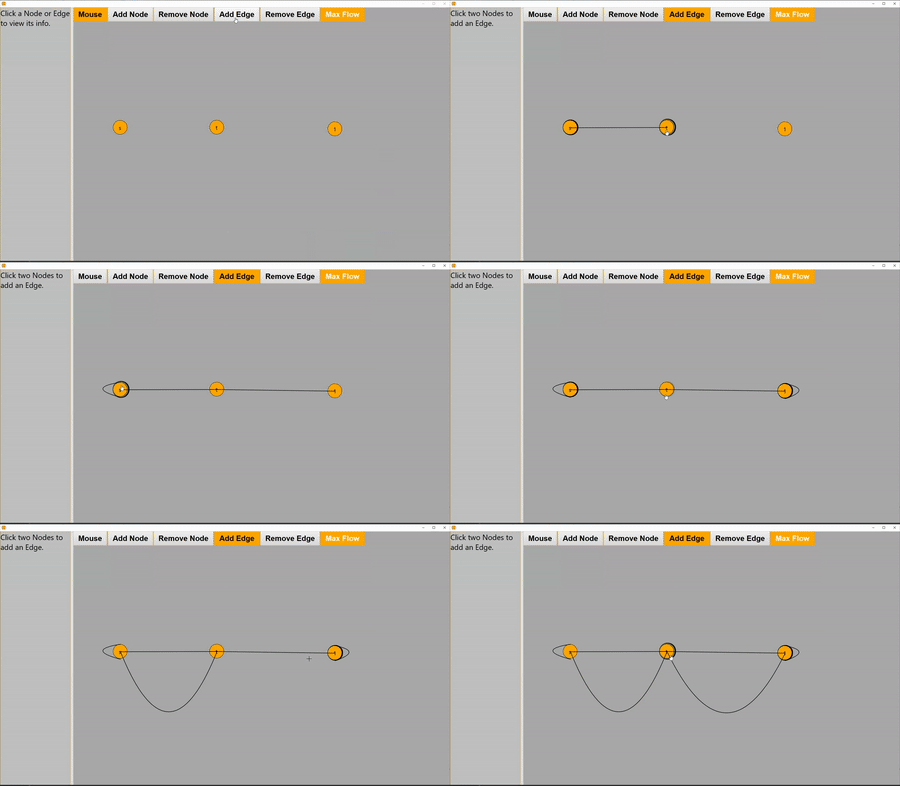
Shows Edges being added to Nodes. Edges can be added from one Node to itself. Edges can also go from node1 to node2 but can also go from node2 to node1.
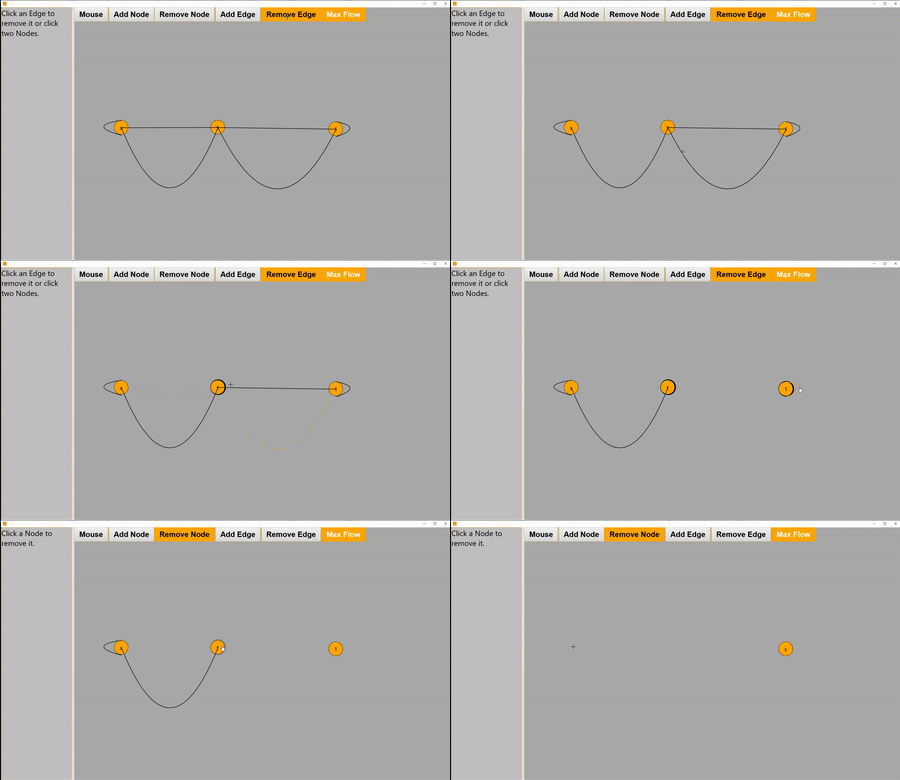
Shows Edges being remove from Nodes. Edges are removed by either clicking on the edge itself or by clicking on the first node of the edge and then the second node of the edge.
Edges connected to a node that was removed are also removed automatically.
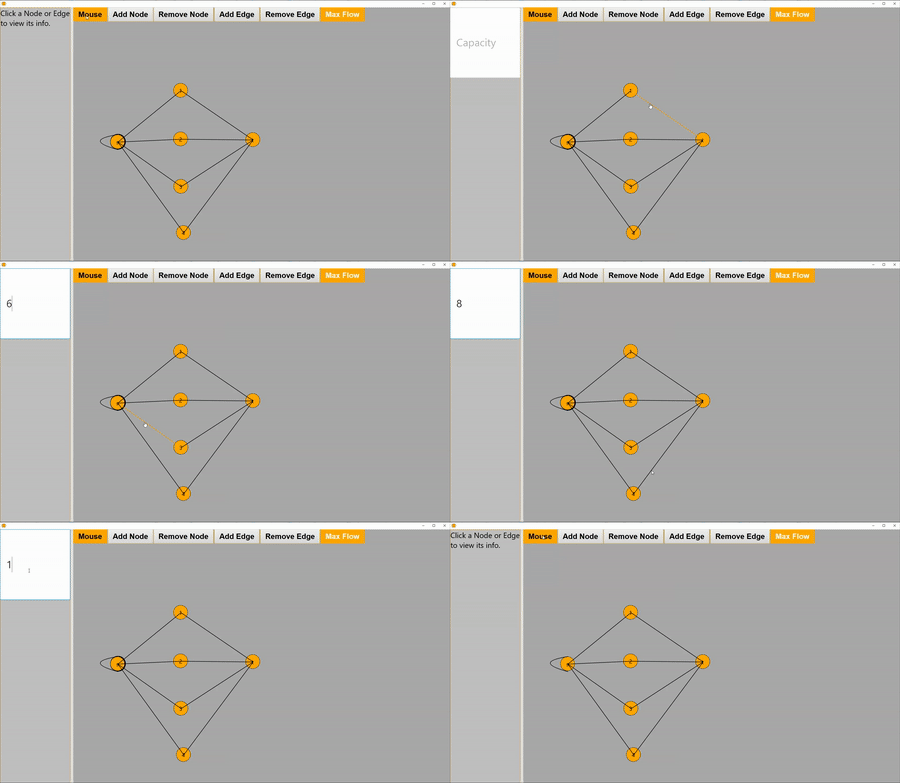
Shows Capacities of the Edges being changed. Hovering over an edge changes the edge to orange and changes the mouse to a hand to make it easier for the user to click on the edge.
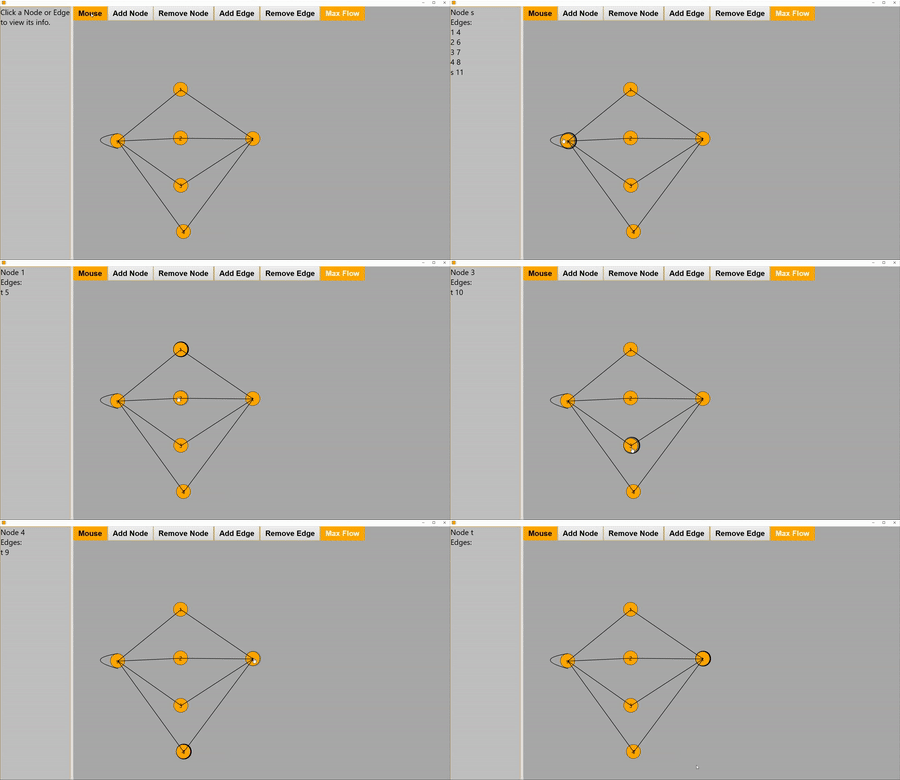
Shows Node Information being viewed by clicking each Node. Node Information shows the connected nodes and the corresponding capacities of the edges.
Shows a very complicated graph that has 20 flow coming out of the Source Node. The Max Flow is calculated and revealed to be 20 aswell.
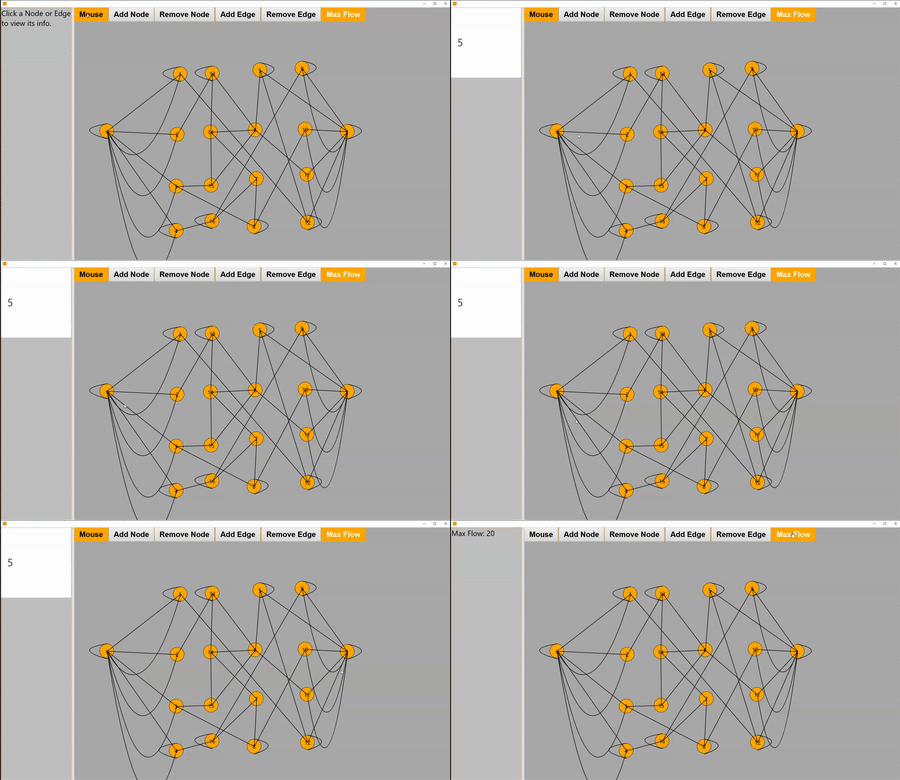
Shows Node with many edges where the scroll bar needs to be used to view all edges.
