Dec 21 - Image neighbourhood manipulation #62
Comments
|
just some experiments can't wrap my head around getting |
|
For this application, you say "slices that contain 255" - do you mean elements that have the value 255? If so, then you'd need to define what operation you want to do. E.g. |
|
Hey, folks! Just got to where I can respond to this.
The big difference between slice(), indexND(), and range() is how they generalize. When acting on a 1-D dataset, slice(), indexND(), and range() can all chop out individual values based on an input index pdl. But they work differently in the more general cases of either more data dimensions or more indexing dimensions. Slicing in particular doesn’t (or didn’t used to) do well with multiple dimensions in the index parameters. IndexND() explicitly has one active dim and everything else is a thread dim — so you can use indexND to implicitly loop over structured arrays of arbitrary points to be extracted. Range() is even more wizzy, pulling out a subregion of the original data at each location you name.
So for local maximum finding you can do this:
$im = get_my_data();
$im_regions = $im->range(ndcoords($im)-1,3,’e’)->mv(3,0)->mv(2,0);
$maxima = whichND( $im_regions->((1),(1)) = $im_regions->maxover->maxover;
The 2nd line creates 3x3 subimages around every point in the original image. The 3rd line finds which of those subimages matches the maximum criterion. At the end, $maxima gets a list of all local maxima. To mark them you can say
$im->indexND($maxima) .= 255;
You can do cooler things very compactly (if somewhat inefficiently) also. To replace each region in an image with the 3x3 median, for example, you can say
$im_medfiltered = $im_regions->clump(2)->medover;
|
gives me |

|
That's really impressive! I'm not sure why you've got By the way, the "true way" of PDL would be to eliminate those |
|
The for loops and $s assignment could be replaced with:
$mc = pdl( [0,5],[10,5],[5,0],[5,10] ); # 2 x 4
$r = $x->range(ndcoords(11,11)-5, [$o->dims], ‘e’); # 11 x 11 x w x h
$s = whichND(
( $r->clump(2)->sumover > 300 ) * # 11 x 11 x w x h --> w x h
( all ( $r->range($mc,[0,0]) < $cutoff ) ) # 4 x w x h --> w x h
); # 2 x n
On Dec 19, 2024, at 3:35 PM, Boyd Duffee ***@***.***> wrote:
use PDL;
use PDL::Graphics::TriD;
use PDL::Graphics2D;
use PDL::Image2D;
use Data::Dumper;
my ***@***.***, );
my $cutoff = 150;
my $o = rim('ohm.png');
my $x = 255 - $o->range([50,50],[150,140]);
for (my $i = 10; $i < 140; $i += 2) {
for (my $j = 10; $j < 130; $j += 2) {
next unless sum( $x->range([$i-5,$j-5],[10,10]) ) > 300;
next unless $x->at($i-5, $j) < $cutoff
&& $x->at($i+5, $j) < $cutoff
&& $x->at($i, $j-5) < $cutoff
&& $x->at($i, $j+5) < $cutoff;
push @Points, [$x->centroid2d($i, $j, 10), 0];
}}
my $s = pdl( @Points);
my $t = $s->rotate(1);
print $t->info;
points3d($t, {PointSize => 2});
gives me
Screenshot.from.2024-12-19.22-34-40.png (view on web) <https://github.com/user-attachments/assets/b9b218bf-9c13-4d61-96c6-1d63b7c30ca9>
—
Reply to this email directly, view it on GitHub <#62 (comment)>, or unsubscribe <https://github.com/notifications/unsubscribe-auth/AAJTGNV24SEJB3XNUHVXH5T2GNC25AVCNFSM6AAAAABT2UZF2KVHI2DSMVQWIX3LMV43OSLTON2WKQ3PNVWWK3TUHMZDKNJVHA4TANRVHE>.
You are receiving this because you were mentioned.
Craig DeForest
303-641-5769
***@***.***
|
|
I think I can get this finished today to give us a bit of breathing room. It's not the full solution, but the way that it breaks is a great hook for me. Fun and Games with ImagesIf you are manipulating images, you need PDL! For years, I've had this urge to use PDL to take a bitmap image and trace the outlines to make an SVG file that I could scale up to A0 poster size without the resulting pixelation. Yes, there are already tools that do that, but where's the fun in that? It's Christmas, the time for Fun and Games! First, let's grab my favourite image and save it locally. A good sanity check. The first time, I used a deprecated library and got this I just want the drawing, so use range and fiddle around until I get the values correct. My brilliant plan is to move a window over the image and use the centroid2d function to map out the the darkest parts. After playing around with I get So how does that work? After reading in the image, cropping it and reversing the values, I get to the nested loops. I must apologize. I switched to TriD's points3d because I was using that module earlier this year and when you have a hammer everything looks like a 3D plot. I had hoped to use the not-brilliant Well, let me tell you that Christmas miracles do happen. He said, The for loops and $s assignment could be replaced with: and like any gift that needs a lot of unwrapping. The ndcoords gives you a 11x11 box centered on 0. I used dims earlier without explaining that it gets the dimensions of the ndarray as a list. We've seen this before, but range with the I will leave whichND and sumover takes the sum along the first dimension. It produces an ndarray with the same dimensions as In conditional expressions, all returns Unfortunately, it's not a drop-in solution because no elements satisfy the conditions and I don't know why ... yet! Public Service Announcement: Joyeux Noël |


(the date here is not set in stone. I'm not precious about where or if it gets used)
My idea of what @drzowie suggested in his email
local maximum finding (use range to extract the neighborhood of each pixel; thread over that to produce a mask that depends on neighborhood properties, such as local-maximum)
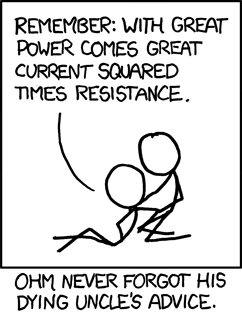
Although @mohawk2 has found existing solutions for tracing images, I've always wanted to grab this image
 and use PDL to find the center of black lines so that I could either scale up or convert to SVG (and print an A0 size poster without the blurry edges)
I think the point of the post is not to say that this is the best solution to the problem, but as an illustration of how
range()andindex2dwork. At first read, it's hard to say what's the difference betweenrangeandslicebecause they both return a section of the pdl. Seeing an example of how the boundary option works would make therangeexplanation clearer and might suggest strategies for improving efficiency. The feature thatslicehas is being able to insert new dimensions on the fly, a useful note to say when you should usesliceinstead ofrange.Having loaded the image and chosen a section near the center
I get
At a guess, I'm seeing the top of Uncle's head (and feels like I've entered the Matrix)
My cheap and cheezy idea was to:
255 - $o)a. find the centroid
b. where there exists a maximum value in the range
c. but only where both edges have values less than the max, so that the centroid is not on the boundary
spheresto make a 3D version I could screencast.I was thinking that spline fitting would be more advanced/professional, but I'm now thinking that, in this case, a centroid method finds the center line perfectly well.
What were you thinking, Craig, and how would I make the iterations more idiomatic?
The text was updated successfully, but these errors were encountered: