-
Notifications
You must be signed in to change notification settings - Fork 1
/
Copy pathnb_import-raster_scgis21.Rmd
80 lines (54 loc) · 2 KB
/
nb_import-raster_scgis21.Rmd
1
2
3
4
5
6
7
8
9
10
11
12
13
14
15
16
17
18
19
20
21
22
23
24
25
26
27
28
29
30
31
32
33
34
35
36
37
38
39
40
41
42
43
44
45
46
47
48
49
50
51
52
53
54
55
56
57
58
59
60
61
62
63
64
65
66
67
68
69
70
71
72
73
74
75
76
77
78
---
title: "Import Raster Data"
output:
html_notebook:
toc: yes
toc_float: yes
---
This Notebook will demonstrate how to import raster GIS data into R.
## Import a Landsat 8 Image
Because Landsat images are multi-band we import them using the `brick()`:
```{r chunk01}
library(raster)
yose_l8_rst <- raster::brick("./data/yose_l8_20180822_b2345.tif")
yose_l8_rst
```
View a summary of the bands:
```{r chunk02}
summary(yose_l8_rst)
```
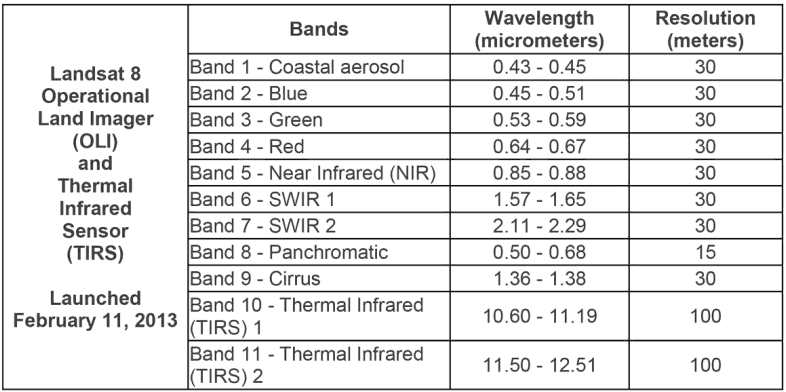
We can tell from the values that Landsat pixel values are 16-bit (0..65536). Remind ourselves of the band combinations for Landsat 8:

## Plot it with plotRGB
Plot a Pseudo True Color:
```{r chunk03}
plotRGB(yose_l8_rst, r=3, g=2, b=1, scale = 2 ^ 16)
```
Isn't that awful? The problem is the range of brightness values is fairly narrow. The Landsat sensor isn't like the camera in your phone, which artificially stretches values to make them look pleasing to the eye.
To make it look better, we can pass the `stretch` argument to have it make a contrast stretch:
```{r chunk04}
plotRGB(yose_l8_rst, r=3, g=2, b=1, scale = 2 ^ 16, stretch = 'lin')
```
\
Plot a False Color Composite:
```{r chunk05}
plotRGB(yose_l8_rst, r=4, g=3, b=2, scale = 2 ^ 16, stretch = 'lin')
```
You can do a lot more with satellite imagery using [RStoolbox](https://bleutner.github.io/RStoolbox/rstbx-docu/spectralIndices.html).
## Plot it with tmap
To overlay the park boundary, we'll use tmap:
```{r chunk06}
library(sf)
library(tmap)
epsg_utm11n_wgs84 <- 32611
yose_bnd_utm <- sf::st_read(dsn="./data", layer="yose_boundary") %>%
st_transform(epsg_utm11n_wgs84)
tm_shape(yose_l8_rst) +
tm_rgb(r=4, g=3, b=2, interpolate = FALSE, max.value = 2 ^ 16) +
tm_shape(yose_bnd_utm) +
tm_borders(col="red", lwd=2) +
tm_layout(legend.show = FALSE)
```
## End
Congratulations, you've completed the Notebook!
To view your Notebook at HTML, save it (again), then click the 'Preview' button in the RStudio toolbar.