-
Notifications
You must be signed in to change notification settings - Fork 0
Assignment #3
Objective: Perform non-thresholded Gene set Enrichment Analysis and visualize the result using Cytoscape
Time estimated: 10 h; taken 20 h;
Date started: 2023-3-29; completed: 2023-4-4
-
As documented in Assignment #1, we used the normalized and mapped dataset with source:
https://www-ncbi-nlm-nih-gov/geo/query/acc.cgi?acc=GSE104406 Aging Human Hematopoietic Stem Cells Manifest Profound Epigenetic Reprogramming of Enhancers That May Predispose to Leukemia (RNA-Seq of HSCe) -
To avoid repetitive calculation, the result of differential gene expression analysis was exported and imported using the following code:
write.csv(output_hits, "HSCe_output_hits", row.names = TRUE)
Then imported with
read.table()Error: the legend of image wasn’t displayed properly Solution: add
r fig MDS, fig.cap="\\label{fig:MDS}
-
Data preperation
- We calculathe the rank using:
$Rank = -log_{10}(p-value) \cdot sign(logFC)$
- We calculathe the rank using:
-
Load geneset
- We used genesets from the baderlab geneset collection containing GO biological process, no IEA and pathways. It is up-to-dated than GSEA default
-
GSEA
- We used the default parameters, limit the geneset size within the range of 15 and 200 to ensure that the results has both specificity and generality, then run the test.

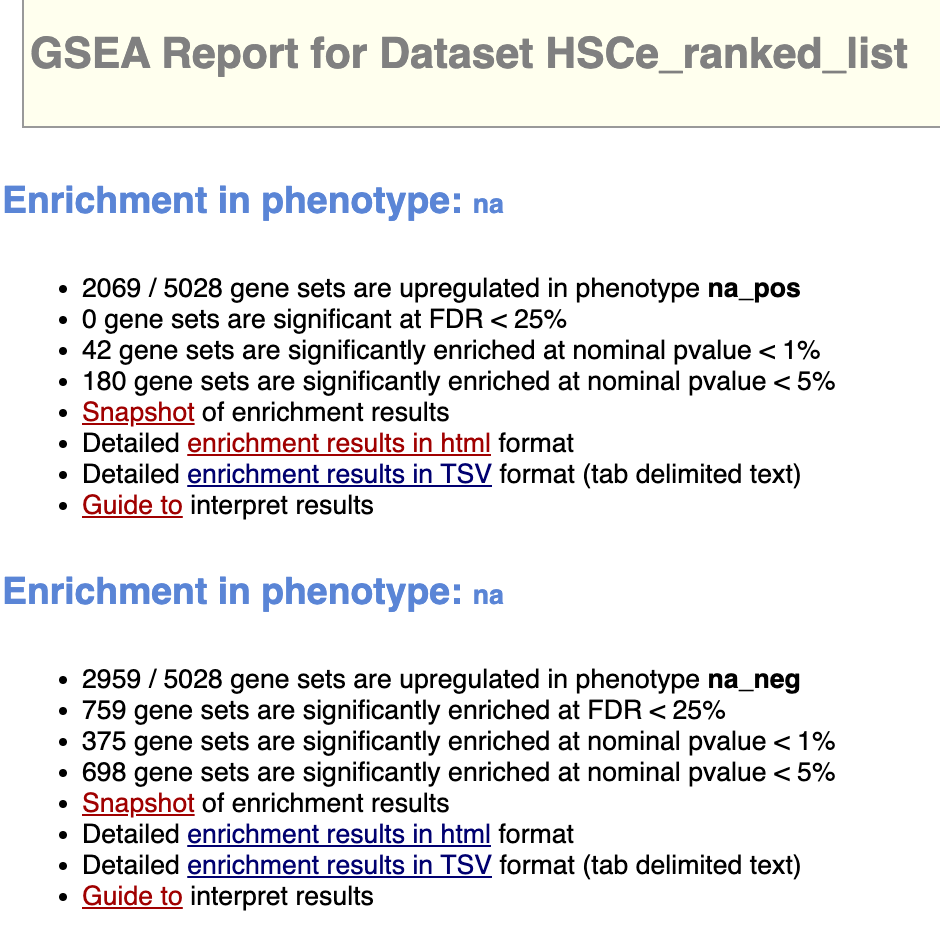
⚠️ It is notable that 0 gene sets are significant at FDR < 25% for the enrichment for the phenotype group: aged, while 754 gene sets are significantly enriched at FDR < 25% for the young group.
- To resolve this issue, we redo the ranking procedure with logFC instead of modified rank, but this issue remains. We verified the biological background, as well as the technical properties of the RNA seq, but we cannot spot the issue because the ORA result is proper. Eventually the only possible explanation is that too few factor to be considered in the previously fitted model, for example gender or individuals in each group can also be crucial factors.
- We use the
EnrichmentMapinCytoscapeto construct the graph, with parameters:- FDR q-value cutoff: 0.7 (otherwise will capture nothing)
- Edge cutoff: 0.375
- We use
AutoAnnotateto construct the annotation and the theme network, with parameters:- MCL clustering algorithm
- Max word per label: 3
- Min word occurrence: 1
- adjacent word bonus: 8
-
We used the signature gene set of Transcription Factors in the newest from the Bader Lab geneset collection (inbuilt download), then we used a two-sided Mann_whitney testing with a threshold p value of 0.05.
names genes largest_overlap Mann_whitney SNRNP70 662 50 1.0545841977460668E-10 CEBPZ 1184 37 3.3938411858613904E-8 SALL4 1353 34 3.949491436006092E-6 -
SALL4,CEBPZ, andSNRNP70which are marked as related transcription factors with HSC or myeloid malignancies in previous researches
💡 Conclusion and outlook: GSEA encountered issue. Found evidences supporting that aging can affect the gene expression hence through the pathways impair functions.

