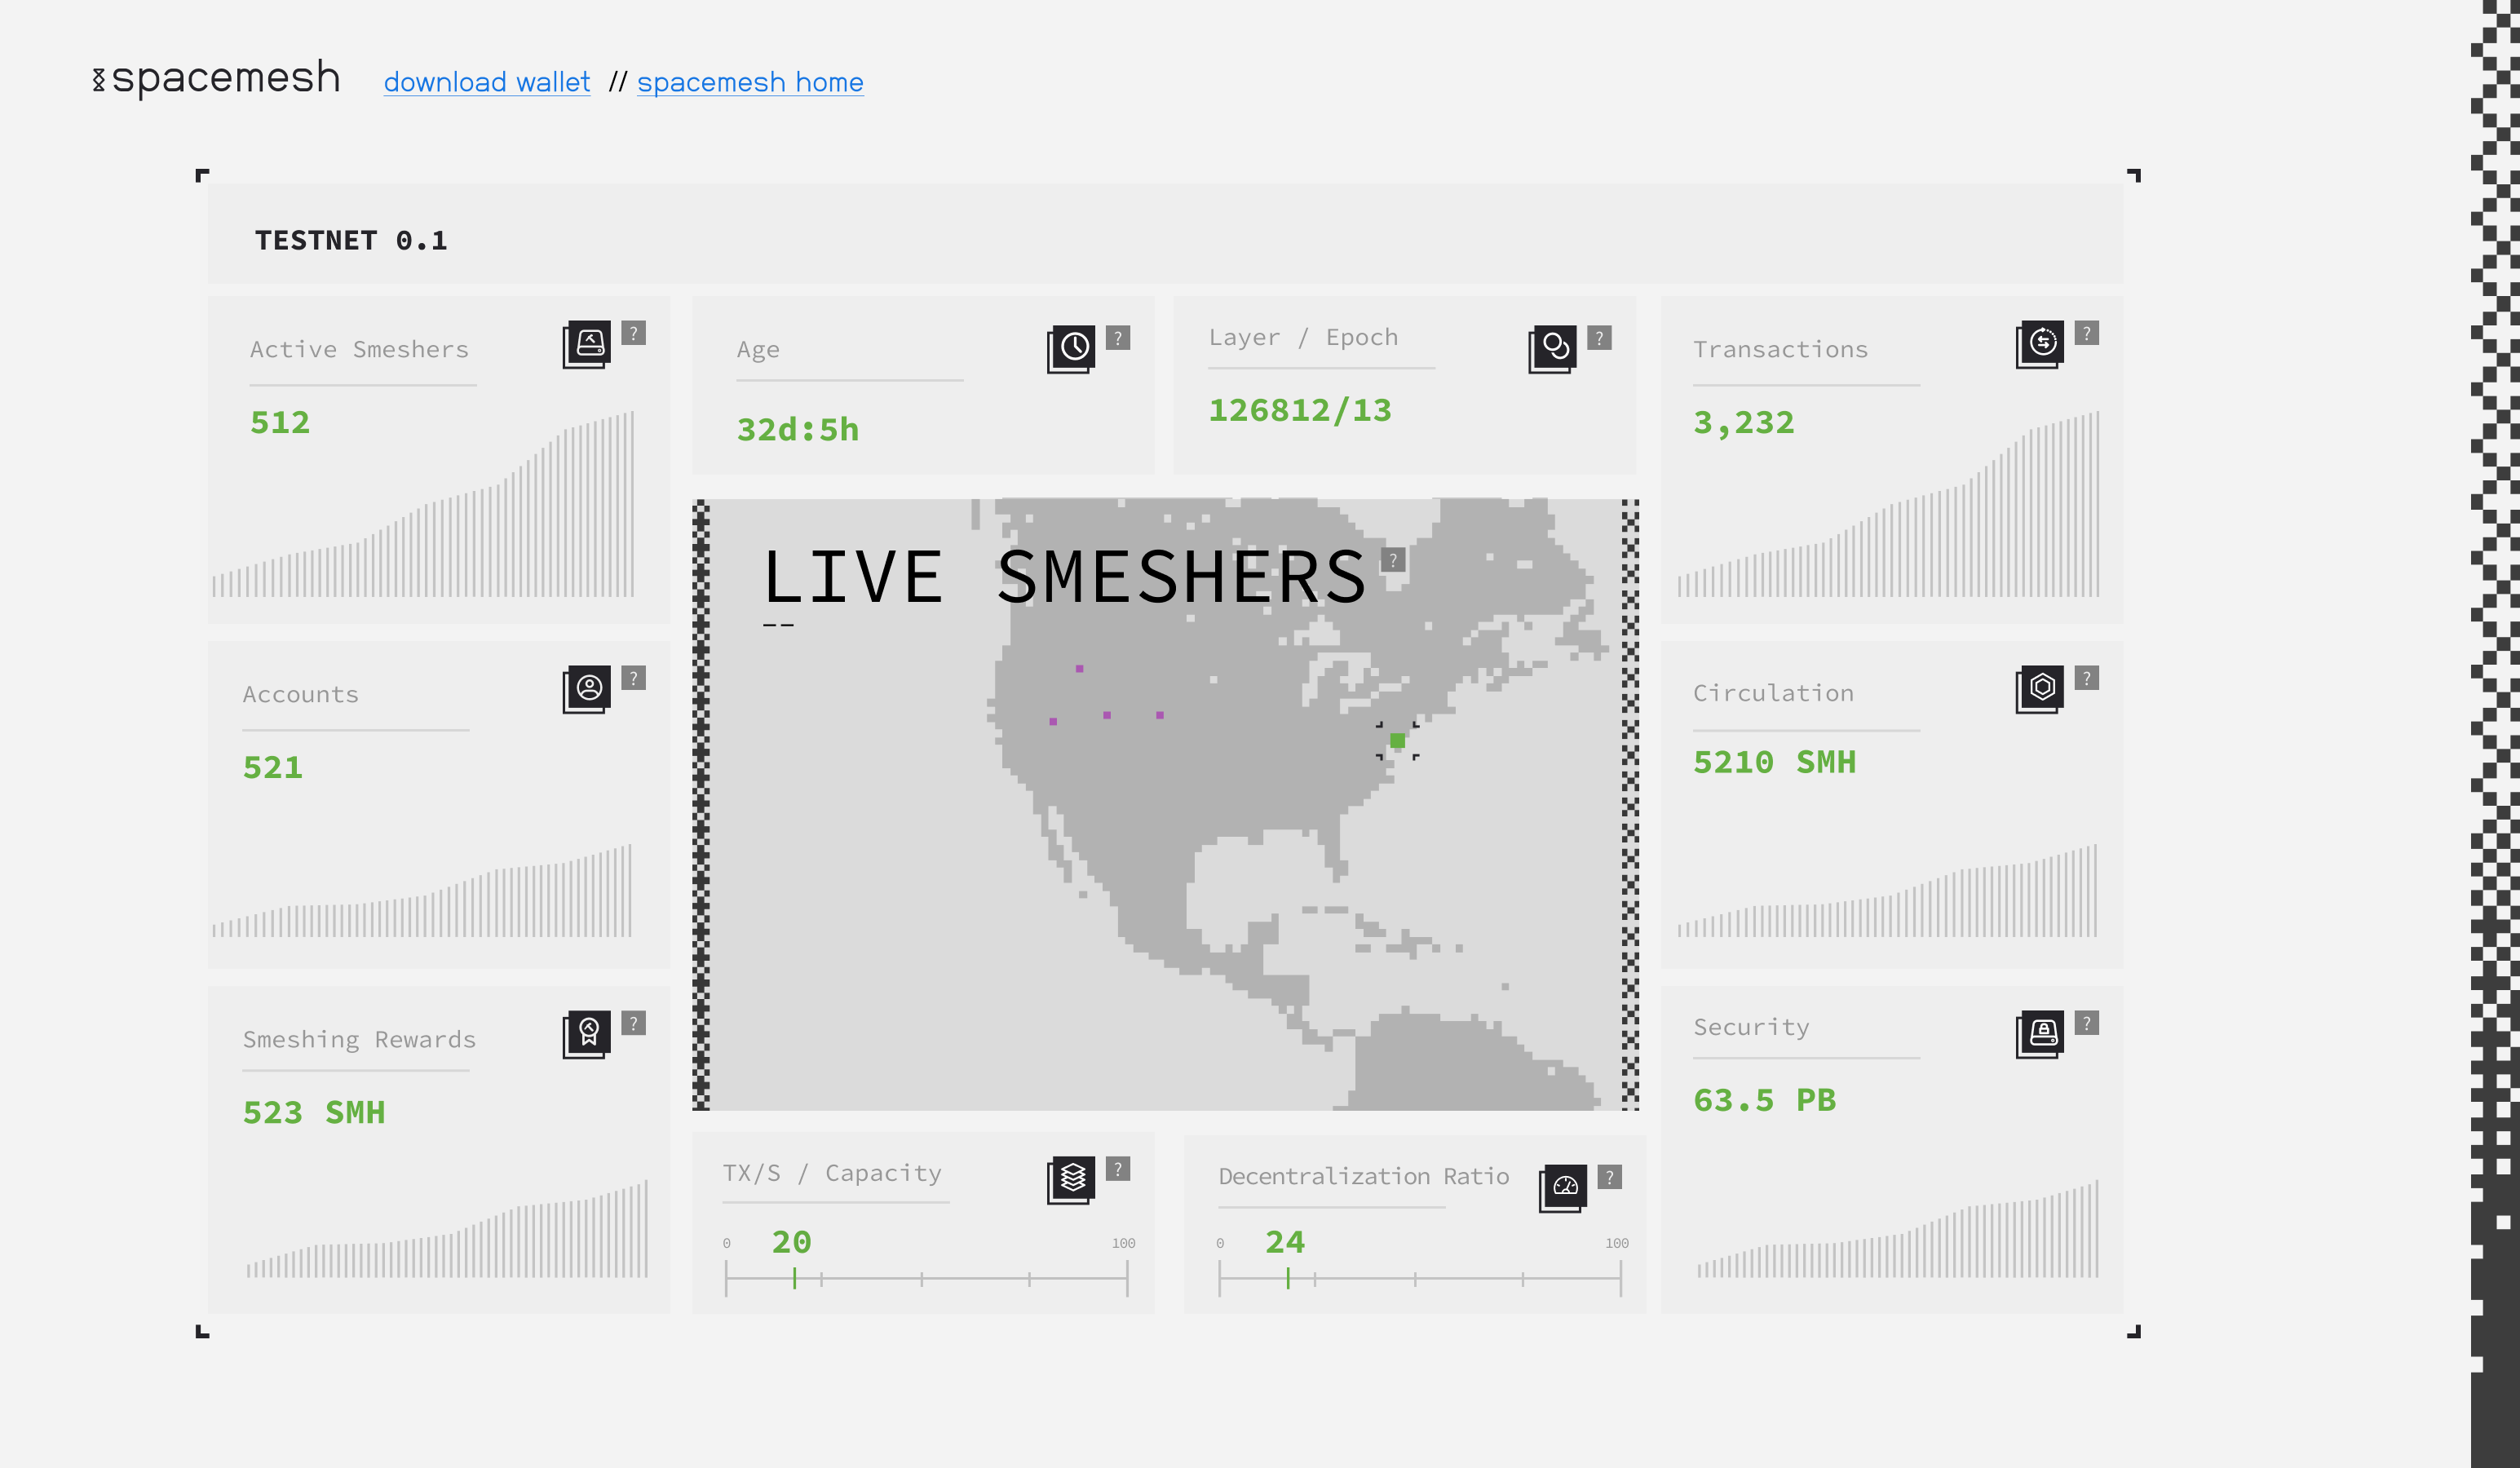
- Dynamic webpage designed for desktop-class screens with a fallback to a mobile layout.
- Real time updates from the mesh.
- Dashboard is always connected to a specific network. e.g. Open Testnet 0.1, Mainent, etc...
- We need to be able to deploy and display a dashboard for different testnets and mainents.
Main display: Number of active miners in the current epoch. Graph: change over time, x-axis: epoch. y-axis: number of active miners.
Main display: Total number of on-mesh accounts with a non-zero coin balance as of the current epoch. Graph: change over time, x-axis: epoch. y-axis: total number of accounts.
Main display: Total amount of Smesh minted as mining rewards as of the last known reward distribution event. Graph: change over time, x-axis: epoch. y-axis: total mining rewards until and including that epoch.
Main display: Total number of Smesh coins in circulation. This is the total balances of all on-mesh accounts. Graph: change over time, x-axis: epoch. y-axis: total number of smesh coins in circulation as of the end of that epoch. Note: the difference between this and the rewards module is that circulation includes any pre-minted coins at genesis.
Main display: Elapsed time since genesis time of the
Main display: Current layer number and current epoch number (1-indexed since genesis)
Main display: total number of transactions processed by the state transition function - e.g. reflected in global state as of the last state transition function (not txs on the mesh in blocks) Graph: x-axis: epoch. y-axis: total number of txs processed by the state transition function up to the end time of that epoch.
Main display: total amount of storage committted to the network based on the ATXs in the previous epoch. Graph: x-axis: epoch. y-axis: total amount of storage as of the epoch start time (atxs in previous epoch).
TBD - distribution of storage between all active miners. Measurement of how long is the tail.
Main display: average tx/s rate over capacity considering all layers in the current epoch. Only processed transactions by the state transition function and not transactions in blocks should be counted. Capacity is defined as the theoretical upper-bound on tx/s based on the network params. Graph: x-axis: epoch. y-axis: same ratio as main display for that epoch.
This is a live heat map of smeshers from around the globe. For a testnet, smeshers can opt-out from reporting ip address for geo-location via the app settings. For a mainent, smeshers can opt-in to report ip address for gelo-location. Nodes show as hot spots over the world's map. The goal of this module is not to identify specific smeshers but to display a measure of the geographic distribution aspect of decentraliztaion.
