-
Notifications
You must be signed in to change notification settings - Fork 69
Monitoring
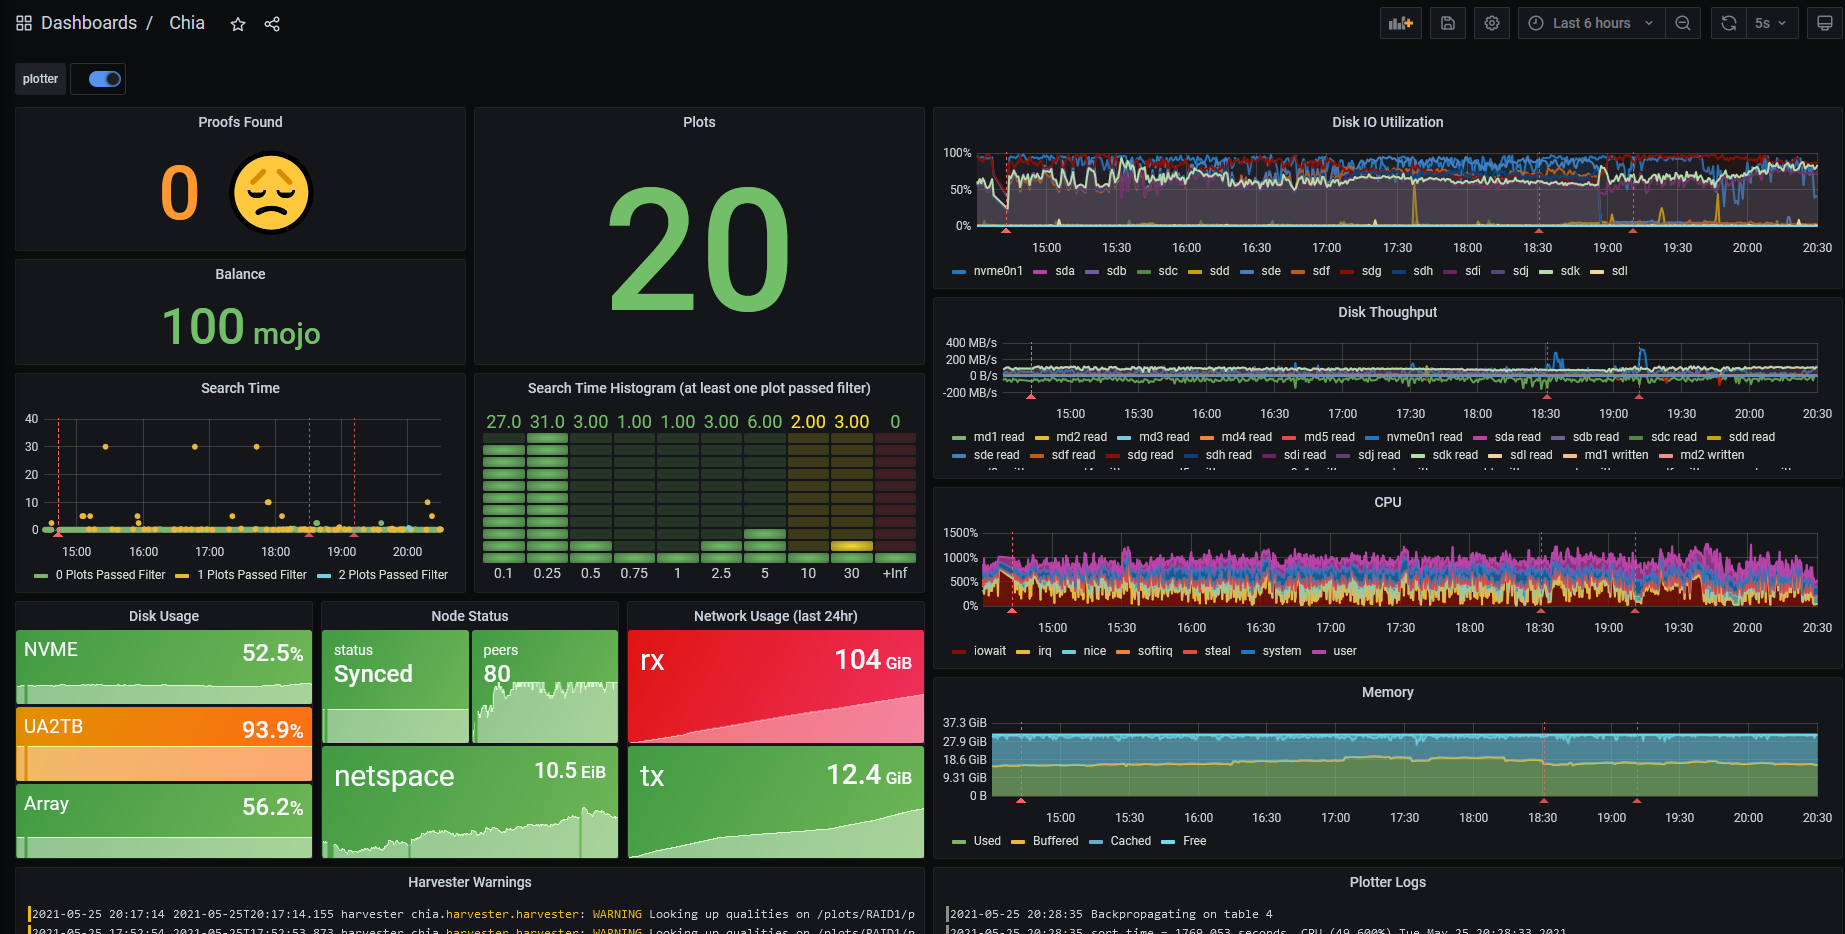
The Grafana dashboard platform can be used to build beautiful reporting of your Chia farming and plotting. Here are some great pre-built dashboards to try:

Prerequirements
- in a normal Unraid Setup the appdata is located in
/mnt/user/appdata - Setup Machinaris from the 'Community Applications' Page
- check that
gitis installed (verify withgit --version) -
docker-composeinstalled (Getdocker-composeon Unraid)
in your unraid terminal (not in the machinaris container) cd into appdata
cd /mnt/user/appdata
then clone the repository from chiamon
git clone https://github.com/retzkek/chiamon
then go into the chiamon directory
cd chiamon
then edit the docker-compose.yml to fit your settings
vi docker-compose.yml / nano docker-compose-yml
example:
services:
  mtail:
    build: mtail
    command:
      - "-progs"
      - "/etc/mtail"
      - "-logs"
      - "/var/log/chia/debug.log"
      - "-logtostderr"
    volumes:
      - /mnt/user/appdata/machinaris/mainnet/log/:/var/log/chia/
    network_mode: host
  node_exporter:
    image: quay.io/prometheus/node-exporter:latest
    command:
      - '--path.rootfs=/host'
    pid: host
    volumes:
      - '/:/host:ro'
    network_mode: host
  chia_exporter:
    build: chia_exporter
    command:
      - "-cert"
      - "/etc/chia.crt"
      - "-key"
      - "/etc/chia.key"
    volumes:
      - /mnt/user/appdata/machinaris/mainnet/config/ssl/full_node/private_full_node.crt:/etc/chia.crt
      - /mnt/user/appdata/machinaris/mainnet/config/ssl/full_node/private_full_node.key:/etc/chia.key
    network_mode: host
  prometheus:
    build: prometheus
    volumes:
      - prom_data:/prometheus
    network_mode: host
  loki:
    image: grafana/loki:2.0.0
    command: -config.file=/etc/loki/local-config.yaml
    network_mode: host
  promtail:
    build: promtail
    volumes:
      - /mnt/user/appdata/machinaris/mainnet/log:/var/log/chia
      - /mnt/user/appdata/machinaris/plotman/logs:/var/log/plotter
    command: -config.file=/etc/promtail/config.yml
    network_mode: host
  grafana:
    build: grafana
    network_mode: host
volumes:
  prom_data:
--> just edit line 20 from the node_exporter section to - '/:/host:ro'
here with the original docker-compose.yaml (- '/:/host:ro,rslave') it will throw a error
then compile the containers with
docker-compose up -d
if everything is working you can go to http://IP_OF_YOUR_SERVER:3000 to visit Grafana
CHIA NETWORK INC, CHIA™, the CHIA BLOCKCHAIN™, the CHIA PROTOCOL™, CHIALISP™ and the “leaf Logo” (including the leaf logo alone when it refers to or indicates Chia), are trademarks or registered trademarks of Chia Network, Inc., a Delaware corporation. There is no affiliation between the Machinaris project and the main Chia Network project.