-
Notifications
You must be signed in to change notification settings - Fork 0
Kickoff Notes (20150609)
Dan Rademacher edited this page Jun 10, 2015
·
1 revision
- test Shapefiles, with both variable numbers of features and forms that aren’t network-able
- look under the hood
- what we understand
- uncontinuous internet
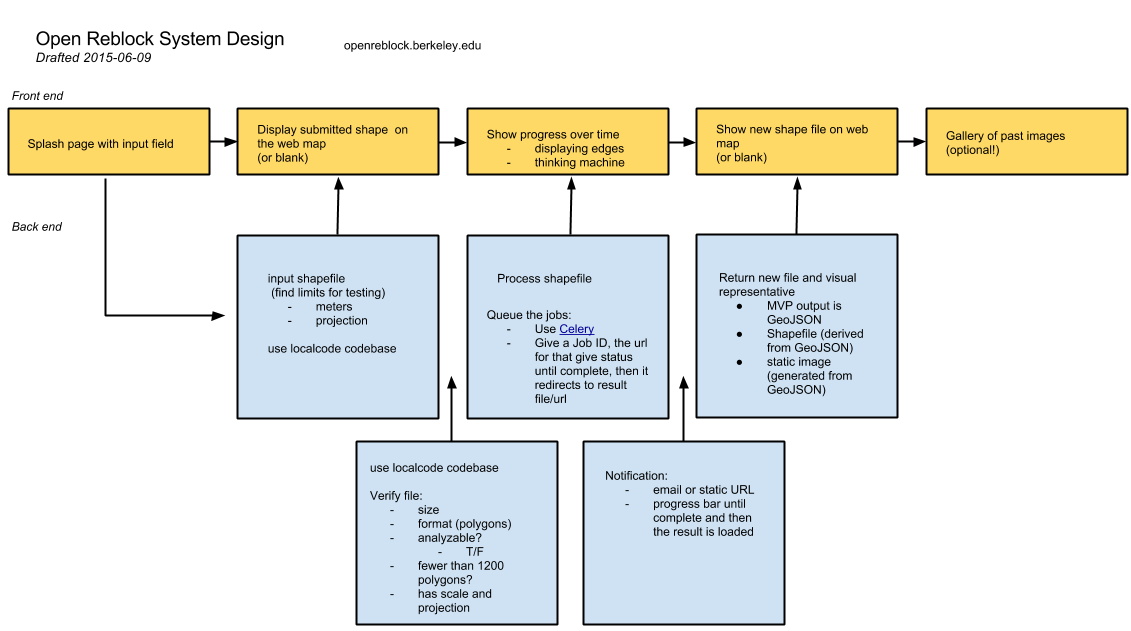
- look to how FieldPapers works with url queuing (same result URL, different display depending on processing status)
- Input Shapefile is in a projection where units are meters (???)
- Input Shapefile contains polygons.
- Output GeoJSON will be in the same coordinate system as the input (without projection information, this could be an unknown coordinate system).
- Communities and community groups
- Visual to the point that community can talk around it
- The users who provide the shapefiles to process will have enough tech skills to use shapefiles out the other side.
- But many people who could look at the results of the process will have internet access, and probably a Facebook account, but little else. So providing easy to use visuals (as tiled map or static map TBD) is important. tiled maps will allow more interactivity (obviously) but are less tolerant of intermittent internet connections.
Thinking Machine by Marius Watz algorithmic decision-making process look at Christa’s code for that -- she has a "show intermediate" option that will render 100 intermediate maps

Find the editable gDocs Drawing here.