In this demo we will explore how to determine a pangenome from a collection of isolate genome sequences in fasta format
This demo relies on two pieces of software, Prokka and Roary, so please remember to cite them if you end up publishing results obtained with these tools
For details on obtaining Prokka and Roary, please visit their GitHub repos here and here.
Assuming you have Prokka and Roary installed and in your PATH variable, go ahead and download the six Listeria monocytogenes genomes we are going to use for this demo. From the Terminal:
	wget https://raw.githubusercontent.com/CBIBUNAB/tutorials/master/genomes/GCA_000008285.1_ASM828v1_genomic.fna
	wget https://raw.githubusercontent.com/CBIBUNAB/tutorials/master/genomes/GCA_000021185.1_ASM2118v1_genomic.fna
	wget https://raw.githubusercontent.com/CBIBUNAB/tutorials/master/genomes/GCA_000026705.1_ASM2670v1_genomic.fna
	wget https://raw.githubusercontent.com/CBIBUNAB/tutorials/master/genomes/GCA_000196035.1_ASM19603v1_genomic.fna
	wget https://raw.githubusercontent.com/CBIBUNAB/tutorials/master/genomes/GCA_000168635.2_ASM16863v2_genomic.fna
	wget https://raw.githubusercontent.com/CBIBUNAB/tutorials/master/genomes/GCA_000168815.1_ASM16881v1_genomic.fna
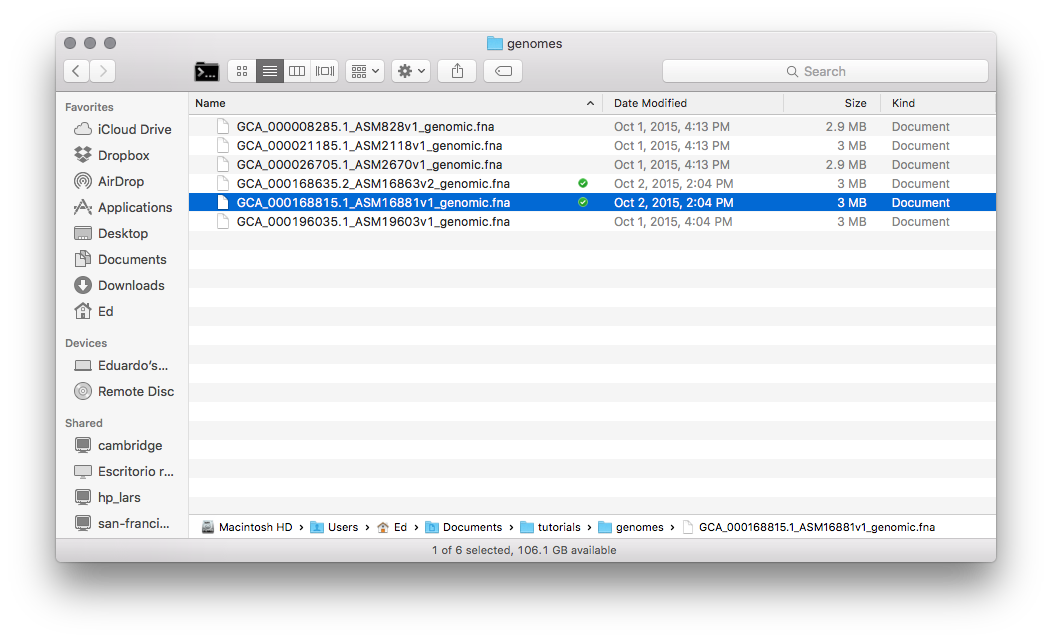
You should get something like the following:
These genomes correspond to isolates of L. monocytogenes reported in Probing the pan-genome of Listeria monocytogenes: new insights into intraspecific niche expansion and genomic diversification PMID: 20846431.
We selected the following six genomes based on their level of completeness (finished; contigs, etc) and their genotype (type I-III)
| Genome Assembly | Genome Accession | Genotype | Sequenced by | Status |
|---|---|---|---|---|
| GCA_000026705 | FM242711 | type I | Institut_Pasteur | Finished |
| GCA_000008285 | AE017262 | type I | TIGR | Finished |
| GCA_000168815 | AATL00000000 | type I | Broad Institute | 79 contigs |
| GCA_000196035 | AL591824 | type II | European Consortium | Finished |
| GCA_000168635 | AARW00000000 | type II | Broad Institute | 25 contigs |
| GCA_000021185 | CP001175 | type III | MSU | Finished |
By annotating the genomes we mean to add information regarding genes, their location, strandedness, and features and attributes. Now that you have the genomes, we need to annotate them to determine the location and attributes of the genes contained in them. We will use Prokka because it's extremely fast and it performs well, and also because the features file that produces (GFF3) is compatible with Roary.
prokka --kingdom Bacteria --outdir prokka_GCA_000008285 --genus Listeria --locustag GCA_000008285 GCA_000008285.1_ASM828v1_genomic.fna
Make sure you annotate the six genomes by replacing the -outdir and -locustag and fasta file accordingly. It should take ~ 4 minutes per genome in a standard laptop computer.
You should end up with 11 files including a .gff file.
I'm copying a description of the output files from the Prokka documentation here, but please check with the developers for in-depth documentation.
| Extension | Description |
|---|---|
| .gff | This is the master annotation in GFF3 format, containing both sequences and annotations. It can be viewed directly in Artemis or IGV. |
| .gbk | This is a standard Genbank file derived from the master .gff. If the input to prokka was a multi-FASTA, then this will be a multi-Genbank, with one record for each sequence. |
| .fna | Nucleotide FASTA file of the input contig sequences. |
| .faa | Protein FASTA file of the translated CDS sequences. |
| .ffn | Nucleotide FASTA file of all the annotated sequences, not just CDS. |
| .sqn | An ASN1 format "Sequin" file for submission to Genbank. It needs to be edited to set the correct taxonomy, authors, related publication etc. |
| .fsa | Nucleotide FASTA file of the input contig sequences, used by "tbl2asn" to create the .sqn file. It is mostly the same as the .fna file, but with extra Sequin tags in the sequence description lines. |
| .tbl | Feature Table file, used by "tbl2asn" to create the .sqn file. |
| .err | Unacceptable annotations - the NCBI discrepancy report. |
| .log | Contains all the output that Prokka produced during its run. This is a record of what settings you used, even if the --quiet option was enabled. |
| .txt | Statistics relating to the annotated features found. |
GFF files are the input for Roary to compute the pangenome and contain all the annotations plus the genome sequence in fasta format appended at the end.
Let's put all the .gff files in the same folder (e.g., ./gff) and run Roary
roary -f ./demo -e -n -v ./gff/*.gff
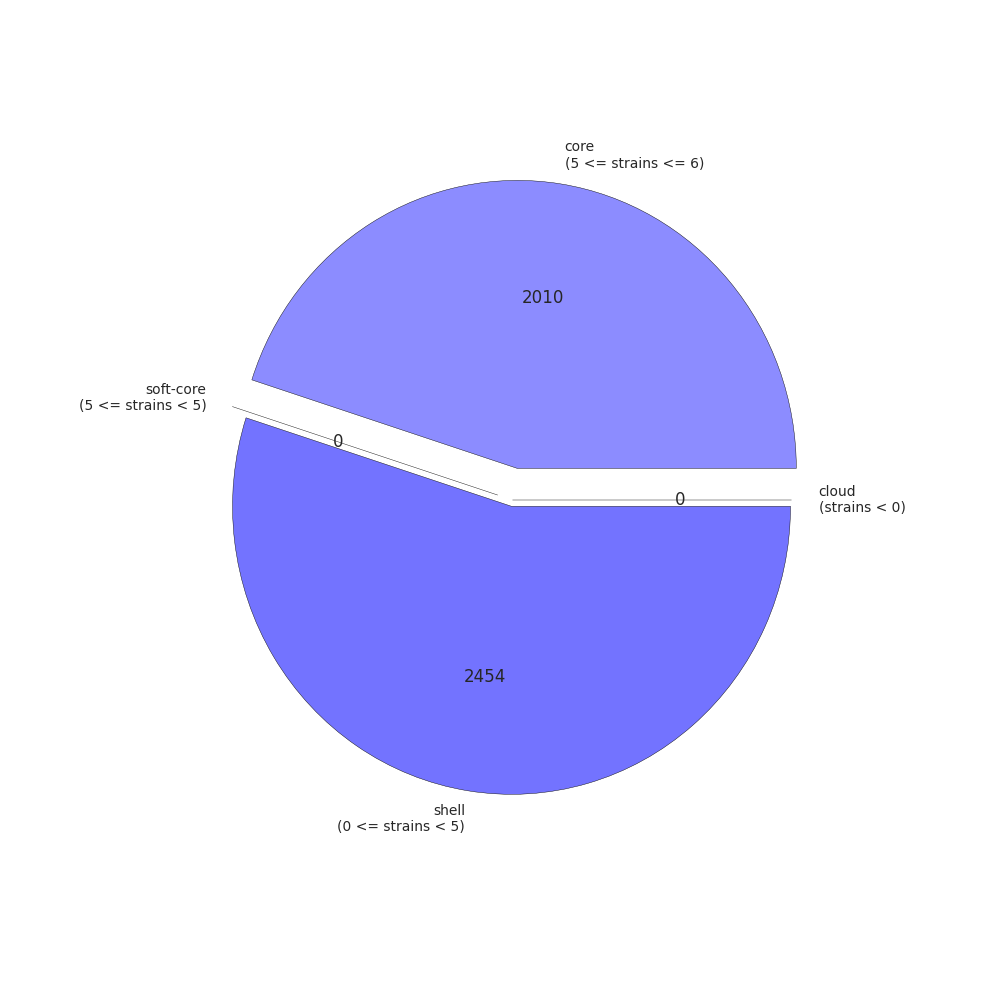
Roary will get all the coding sequences, convert them into protein, and create pre-clusters. Then, using BLASTP and MCL, Roary will create clusters, and check for paralogs. Finally, Roary will take every isolate and order them by presence/absence of orthologs. The summary output is present in the summary_statistics.txt file. In our case, the results are as follows:
| Genes | Number |
|---|---|
| Core genes (99% <= strains <= 100%) | 2010 |
| Soft core genes (95% <= strains < 99%) | 0 |
| Shell genes (15% <= strains < 95%) | 2454 |
| Cloud genes (0% <= strains < 15%) | 0 |
| Total genes | 4464 |
Additionally, Roary produces a gene_presence_absence.csv file that can be opened in any spreadsheet software to manually explore the results. In this file, you will find information such as gene name and gene annotation, and, of course, whether a gene is present in a genome or not.
We already have a phylogeny that represents the evolutionary history of this six isolates, where they form clades according to their genotype, i.e., type I isolates together, and so on.
When you analyze your own data, you will need a phylogeny that represents the evolutionary history of your isolates. The inference of a phylogenetic tree is not part of roary's functions, but you can use the core gene alignment (file: core_gene_alignment.aln) as input to infer a tree.
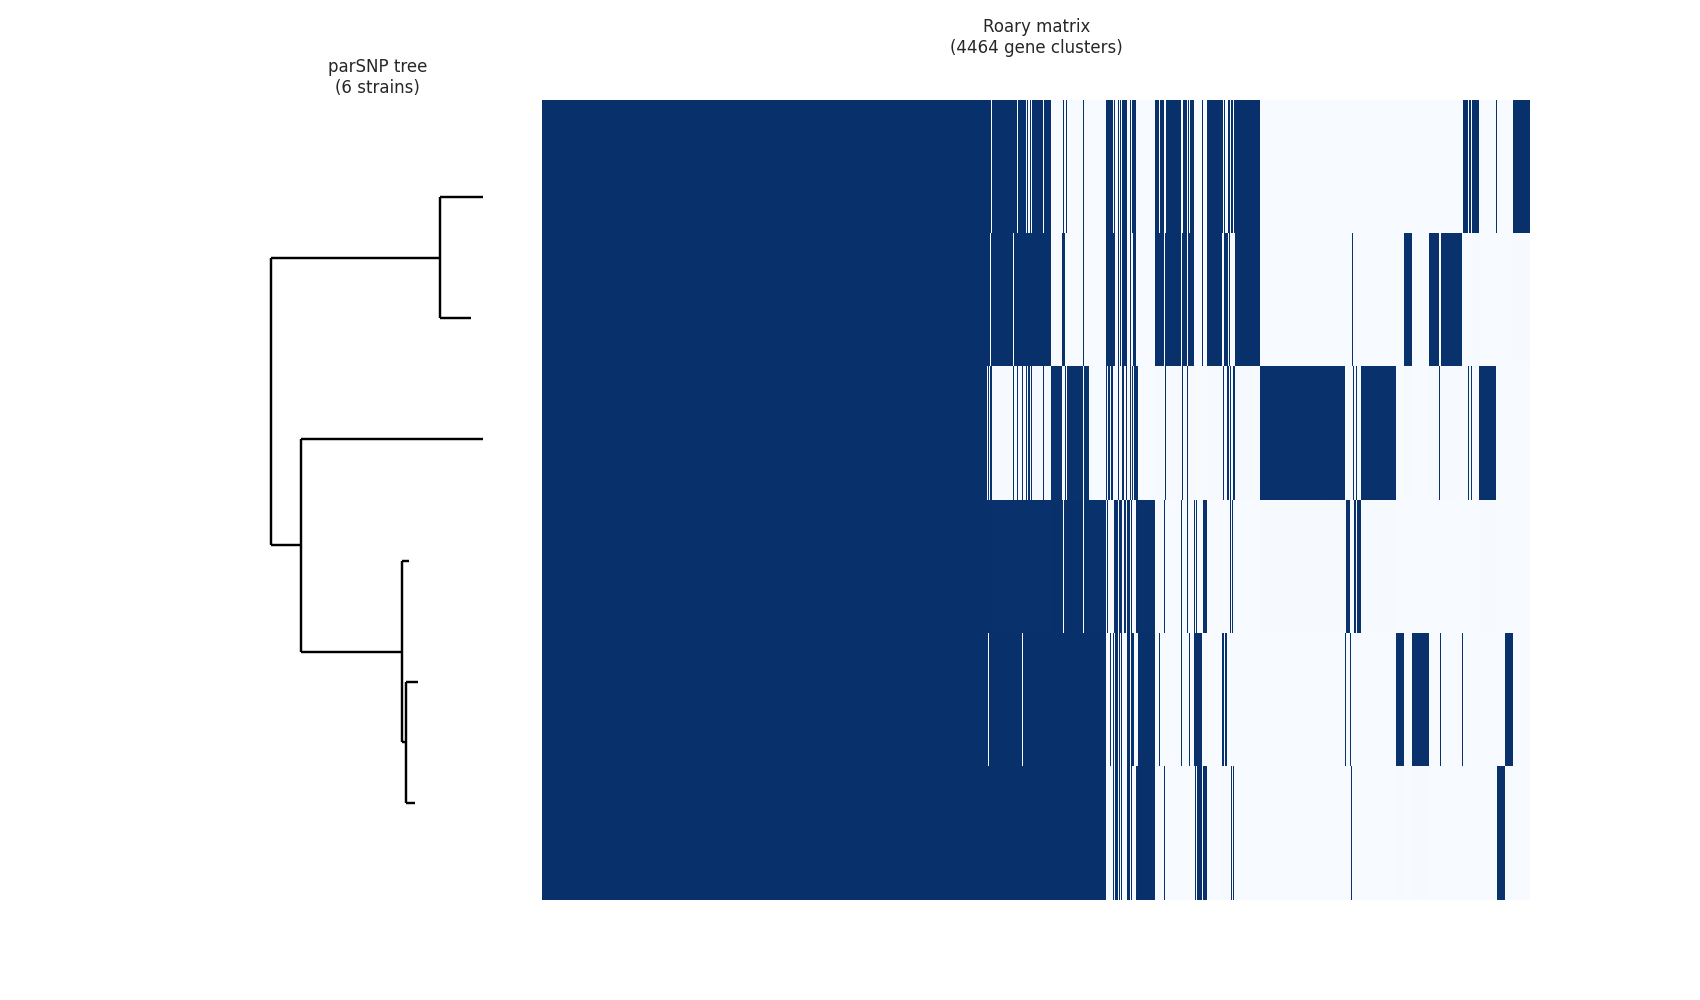
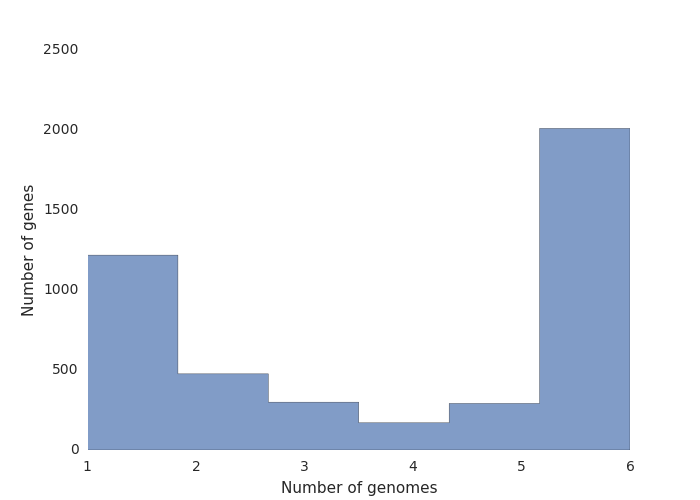
Roary comes with a python script that allows you to generate a few plots to graphically assess your analysis output. You will need the gene_presence_absence.csv file and the phylogeny, which you can get from here. Then try using the following command:
python roary_plots.py core_gene_alignment.nwk gene_presence_absence.csv
You should get three files: a pangenome matrix, a frequency plot, and a pie chart.
We have already Genome annotation and Pangenome analysis, but if you wanna know the sequence of a gene in particular in the pangenome you have to search by your own the sequence in the .ffn files. To avoid this inconvenient, Enzo Guerrero-Araya wrote a script in Python3 that make csv files of all loci in the pangenome. The csv's files can be imported to a database like Sqlite3.
Let's put all the .ffn files in the same folder (e.g., ./ffn) and run DBGenerator.py in the same directory where is the gene_presence_absence.csv file.
python3 DBGenerator.py ffn
The script in this version will generate 4 csv files:
| Files | Description |
|---|---|
| genomas_locus.csv | It contains 2 columns [name of genome, name of locus] |
| pangenoma.csv | It contains all the information of the annotation that Roary reported in the gene_presence_absence.csv file |
| pangenoma_locus.csv | It contains 2 columns [name of gene, name of locus] |
| locus_sequence.csv | It contains 2 columns [name of locus, nucleotide sequence] |
Now we have all csv files for make our own database, in terminal you have to type:
sqlite3 database.sqlite
In the sqlite3 prompt rum:
create table genomas_locus (cod text, locus text);
create table pangenoma (gene text, non_unique_gene_name text, annotation text, no_isolates integer, no_sequences integer, avg_sequences_per_isolate integer, genome_fragment integer, order_within_fragment integer, accessory_fragment integer, accessory_order_with_fragment integer, qc text, min_group_size_nuc integer, max_group_size_nuc integer, avg_group_size_nuc integer);
create table pangenoma_locus (gene text, locus text);
create table locus_sequence (locus text, sequence text);

.separator '|'
.import genomas_locus.csv genomas_locus
.import pangenoma.csv pangenoma
.import pangenoma_locus.csv pangenoma_locus
.import locus_sequence.csv locus_sequence

create index genomas_locus_index on genomas_locus(cod, locus);
create index pangenoma_index on pangenoma(gene, non_unique_gene_name, annotation, no_isolates, no_sequences, avg_sequences_per_isolate, genome_fragment, order_within_fragment, accessory_fragment, accessory_order_with_fragment, qc, min_group_size_nuc, max_group_size_nuc, avg_group_size_nuc);
create index pangenoma_locus_index on pangenoma_locus(gene, locus);
create index locus_sequence_index on locus_sequence(locus, sequence);
Now just we have to join tables with sql query like:
select '>'|| cod || '|' || locus_sequence.locus || '|' || pangenoma.gene || x'0a' || sequence
from locus_sequence
inner join pangenoma_locus on locus_sequence.locus = pangenoma_locus.locus
inner join pangenoma on pangenoma_locus.gene = pangenoma.gene
inner join genomas_locus on locus_sequence.locus = genomas_locus.locus
where pangenoma.gene = 'tetC';

>GCA_000008285_01152016|GCA_000008285_02480|tetC
ATGGAAAAGAAGCGGACTCGGGCAGAAGAATTAGGAATAACTAGAAGAAAAATTTTGGATACAGCACGTGATTTATTTATGGAAAAGGGTTACCGGGCAGTTTCAACAAGAGAAATAGCTAAAATTGCCAACATTACCCAACCGGCACTATATCACCACTTTGAAGATAAAGAATCCCTATATATTGAAGTGGTTCGTGAATTGACGCAAAATATCCAAGTGGAAATGCATCCAATTATGCAAGTGACCAAAGCAAAAGAAGAACAATTACATGATATGTTAATTATGTTAATTGAGGAACATCCAACCAATATTCTATTAATGATTCACGATATTCTTAATGAAATGAAACCAGAAAATCAATTTTTACTTTATAAATTATGGCAAAAAACCTATTTGGAACCATTTCAACTATTTTTTGAGCGTCTAGAAAATGCTGGCGAATTGCGTGATGGTGTCAGTGCTGAGACTGCTGCGAGATACTGTTTGTCCACTATTAGCCCTCTTTTTTCTGGGAAAGGCAGCTTTGCGCAAAAGCAAACGACTACAGAACAAATTGATGAATTAATCAACTTAATGATGTTTGGTATATGTAAAAAAGAGGTATAA
>GCA_000021185_01152016|GCA_000021185_00131|tetC
ATGGAAAAGAAGCGGACTCGAGCAGAAGAATTAGGAATAACCAGAAGGAAAATCCTTGATACAGCAAGGGATTTATTTATGGAAAAAGGGTACCGGGCAGTCTCGACAAGAGAAATTGCTAAAATTGCCAAAATTACCCAACCAGCACTTTATCACCATTTTGAAGATAAAGAATCACTTTATATTGAAGTAGTTCGTGAATTGACGCAAAATATTCAAGTGGAAATGCACCCAATTATGCAAACGAGCAAAGCAAAAGAAGAACAACTGCATGATATGTTAATCATGTTAATTGAGGAGCATCCAACCAATATTCTGCTAATGATTCATGATATTCTTAATGAAATGAAGCCAGAAAATCAATTTTTACTTTATAAATTGTGGCAAAAAACCTATTTAGAACCATTTCAAGACTTTTTTGAGCGATTAGAAAATGCTGGCGAATTGCGTGATGGTATCAGTGCTGAGACCGCTGCGAGATACTGTTTATCCACTATTAGCCCGCTTTTTTCAGGGAAAGGTAGCTTTGCGCAAAAGCAAACGACTACAGAACAAATCGATGAATTAATCAACTTAATGATGTTTGGCATATGTAAAAAAGAGGTATAA
>GCA_000026705_01152016|GCA_000026705_02479|tetC
ATGGAAAAGAAGCGGACTCGGGCAGAAGAATTAGGAATAACTAGAAGAAAAATTTTGGATACAGCACGTGATTTATTTATGGAAAAGGGTTACCGGGCAGTTTCAACAAGAGAAATAGCTAAAATTGCCAACATTACCCAACCGGCACTATATCACCACTTTGAAGATAAAGAATCCCTATATATTGAAGTGGTTCGTGAATTGACGCAAAATATCCAAGTGGAAATGCATCCAATTATGCAAGTGACCAAAGCAAAAGAAGAACAATTACATGATATGTTAATTATGTTAATTGAGGAACATCCAACCAATATTCTATTAATGATTCACGATATTCTTAATGAAATGAAACCAGAAAATCAATTTTTACTTTATAAATTATGGCAAAAAACCTATTTGGAACCATTTCAACTATTTTTTGAGCGTCTAGAAAATGCTGGCGAATTGCGTGATGGTGTCAGTGCTGAGACTGCTGCGAGATACTGTTTGTCCACTATTAGCCCTCTTTTTTCTGGGAAAGGCAGCTTTGCGCAAAAGCAAACGACTACAGAACAAATTGATGAATTAATCAACTTAATGATGTTTGGTATATGTAAAAAAGAGGTATAA
>GCA_000168635_01152016|GCA_000168635_02549|tetC
ATGGAAAAGAAGCGGACTCGAGCAGAAGAATTAGGAATAACTAGAAGAAAAATTTTGGATACAGCACGTGATTTATTTATGGAAAAGGGTTACCGGGCAGTTTCTACAAGAGAAATAGCTAAAATTGCTAACATTACCCAACCGGCACTTTATCATCACTTTGAAGATAAAGAATCCCTATATATTGAAGTGGTTCGTGAATTGACGCAAAATATCCAGGTGGAAATGCATCCAATTATGCAAACGAACAAAGCAAAAGAAGAACAATTACATGATATGTTAATTATGTTAATTGAGGAACATCCCACCAATATTCTATTAATGATTCACGATATTCTTAATGAAATGAAACCAGAGAATCAATTTTTACTTTATAAATTATGGCAAAAAACCTATTTAGAACCATTTCAACAATTTTTTGAGCGTCTAGAAAATGCTGGTGAATTGCGTAATGGTATCAGTGCTGAGACCGCTGCAAGATACTGTTTGTCCACTATTAGCCCTCTTTTTTCAGGGAAAGGTAGCTTTGCGCAAAAGCAAACGACTACAGAACAAATCGATGAATTAATCAACTTAATGATGTTTGGCATATGTAAAAAAGAGGTATAA
>GCA_000168815_01152016|GCA_000168815_01572|tetC
ATGGAAAAGAAGCGGACTCGGGCAGAAGAATTAGGAATAACTAGAAGAAAAATTTTGGATACAGCACGTGATTTATTTATGGAAAAGGGTTACCGGGCAGTTTCAACAAGAGAAATAGCTAAAATTGCCAACATTACCCAACCGGCACTATATCACCACTTTGAAGATAAAGAATCCCTATATATTGAAGTGGTTCGTGAATTGACGCAAAATATCCAAGTGGAAATGCATCCAATTATGCAAGTGACCAAAGCAAAAGAAGAACAATTACATGATATGTTAATTATGTTAATTGAGGAACATCCAACCAATATTCTATTAATGATTCACGATATTCTTAATGAAATGAAACCAGAAAATCAATTTTTACTTTATAAATTATGGCAAAAAACCTATTTGGAACCATTTCAACTATTTTTTGAGCGTCTAGAAAATGCTGGCGAATTGCGTGATGGTGTCAGTGCTGAGACTGCTGCGAGATACTGTTTGTCCACTATTAGCCCTCTTTTTTCTGGGAAAGGCAGCTTTGCGCAAAAGCAAACGACTACAGAACAAATTGATGAATTAATCAACTTAATGATGTTTGGTATATGTAAAAAAGAGGTATAA
>GCA_000196035_01152016|GCA_000196035_02552|tetC
ATGGAAAAGAAGCGGACTCGAGCAGAAGAATTAGGAATAACTAGAAGAAAAATTTTGGATACAGCACGTGATTTATTTATGGAAAAGGGTTACCGGGCAGTTTCTACAAGAGAAATAGCTAAAATTGCCAACATTACCCAACCGGCACTGTATCATCACTTTGAAGATAAAGAATCCCTATATATTGAAGTGGTTCGTGAATTGACGCAAAATATCCAGGTGGAAATGCATCCAATTATGCAAACGAACAAAGCAAAAGAAGAACAATTACATGATATGTTAATTATGTTAATTGAGGAACATCCCACCAATATTCTATTAATGATTCACGATATTCTTAATGAAATGAAACCAGAGAATCAATTTTTACTTTATAAATTATGGCAAAAAACCTATTTAGAACCATTTCAACAATTTTTTGAGCGTCTAGAAAATGCTGGTGAATTGCGTAATGGTATCAGTGCTGAGACCGCTGCAAGATACTGTTTGTCCACTATTAGCCCTCTTTTTTCAGGGAAAGGTAGCTTTGCGCAAAAGCAAACGACTACAGAACAAATCGATGAATTAATCAACTTAATGATGTTTGGCATATGTAAAAAAGAGGTATAA
And thats its all. we get all sequences in fasta format of tetC gene.
Seemann T.
Prokka: rapid prokaryotic genome annotation
Bioinformatics 2014 Jul 15;30(14):2068-9.
PMID:24642063
Andrew J. Page, Carla A. Cummins, Martin Hunt, Vanessa K. Wong, Sandra Reuter, Matthew T. G. Holden, Maria Fookes, Daniel Falush, Jacqueline A. Keane, Julian Parkhill.
Roary: Rapid large-scale prokaryote pan genome analysis
Bioinformatics 2015 Jul 20. pii: btv421
PMID: 26198102


