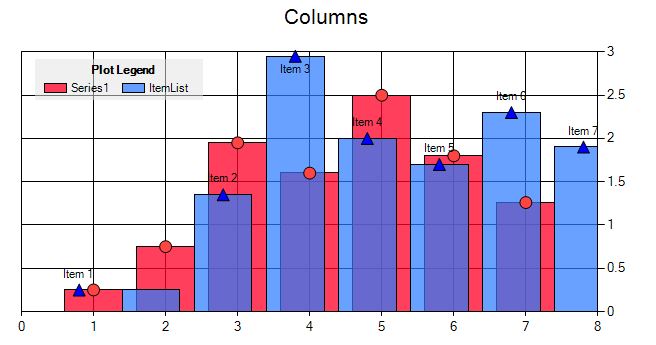
Add on extensions for graphing in LabVIEW using the MSCharts free component for .NET. This allow many types of graphs that are not available in LabVIEW to be implemented with fixed data sets.
It is NOT intended for LIVE graphs or real time data on graphs. While the .net control can handle that, just fine with data binding, this has not been built into this toolkit for LabVIEW, but is something others are welcome to contribute.
This component for LabVIEW uses the Microsoft .NET Charts component, which is freely available for .NET3.5+ and can be downloaded here:
Once installed, you can simply download the source code for this repository, and open the project file in the archive to view samples of the various charts and start using or playing with it in LabVIEW. This source repository is in LabVIEW 2015, it would be great to have someone contribute if they want to save back older versions.
Several examples are included, one to demo through all the chart types with some basic data. Another for multi plots, again showing a number of options.
