Testing Kalman Filter for accelerometer data
- Guava
acc_log.dat filewith format:
timestamp [millis] | accelerometer (one of axis)

65464208 0.25911117
65464260 0.20279828149999996
65464281 0.2315574732583333
65464293 0.1434090791808333
65464309 0.14202263688562494
.
.
.
Adjust:
constants.Constants.FILTER_GAINto value in range [0.0 - 1.0]. Smaller the value is -> Kalman filter algorithm has less impact to the final data.
new_acc_log.datUsage with gnuplot:
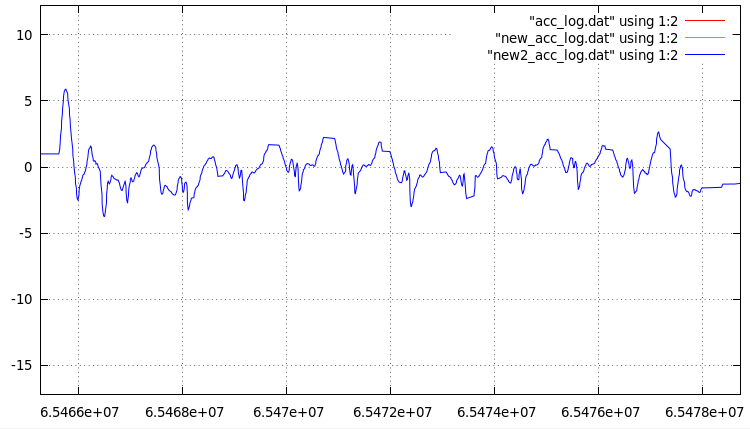
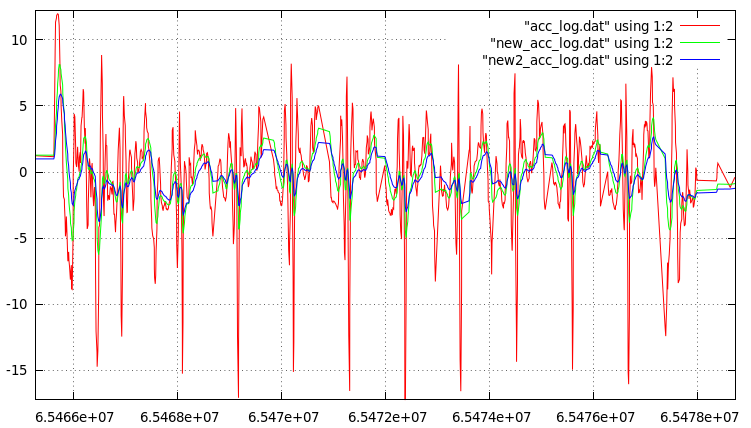
plot "acc_log.dat" using 1:2 w l, "new_acc_log.dat" using 1:2 w lALL (raw data + two Kalman charts):
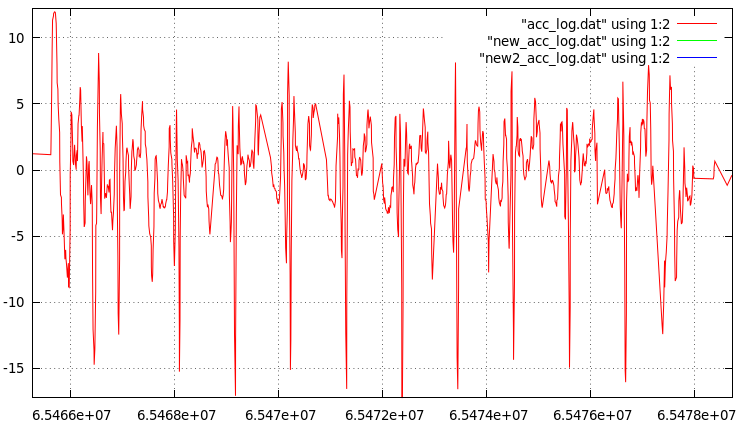
RAW DATA:
KALMAN FILTER WITH FILTER_GAIN == 0.9:
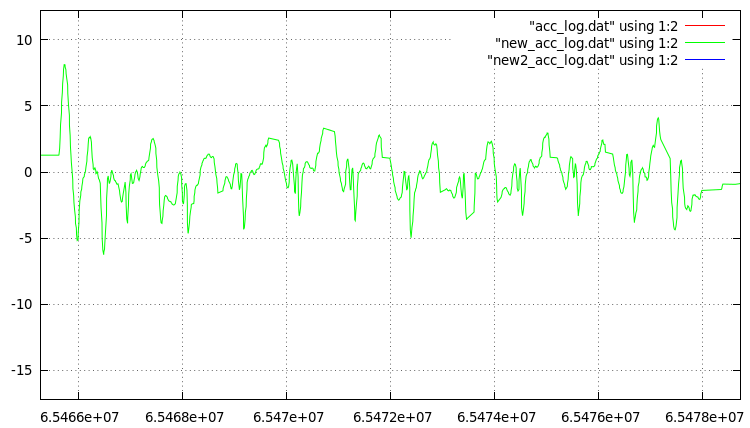
KALMAN FILTER WITH FILTER_GAIN == 0.95: