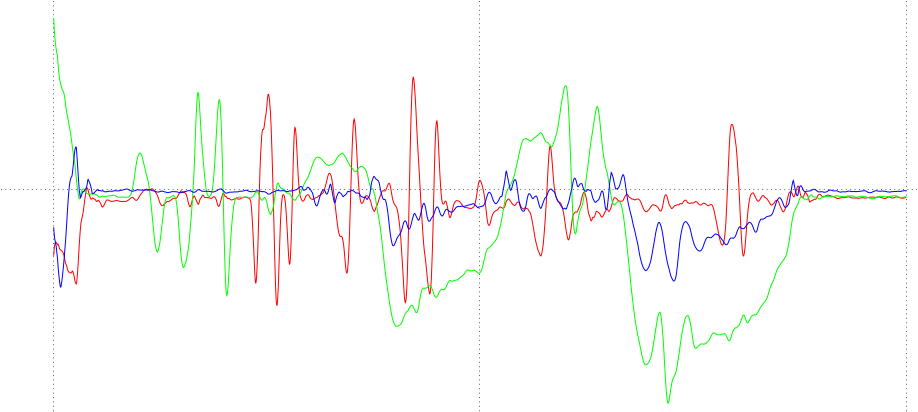
Testing SensorFusion for Linear Accelerating, using accelerometer, gyroscope and magnetometer
- Guava
log.dat filewith format:
No | dT | accX | accY | accZ | gyroX | gyroY | gyroZ | magX | magY | magZ |

0 0 -2.5694069862365723 6.678661823272705 8.309669494628906 0.13429681956768036 -0.09699258953332901 -1.2481106519699097 -1.4665679931640625   -9.835296630859375 -34.16761779785156
1 9948731 -1.7887802124023438 5.374423980712891 7.456593990325928 -0.023448867723345757 -0.4668428301811218 -1.3514983654022217 -1.4665679931640625 -9.835296630859375 -34.16761779785156
2 10009765 -1.2989987134933472 4.559518337249756 6.995851993560791 -0.44019657373428345 -1.0413357019424438 -1.6158287525177002 -1.4665679931640625 -9.835296630859375 -34.16761779785156
3 10009766 -1.59238862991333 4.45099401473999 7.365882396697998 -0.8334951400756836 -1.7469284534454346 -1.7906283140182495 -1.9665679931640625 -9.329483032226563 -34.279327392578125
.
.
.
new_log.datUsage with gnuplot:
Old chart with acceleration
plot "log.dat" using 1:3 w l, "log.dat" using 1:4 w l, "log.dat" using 1:5 w lNew chart with acceleration:
plot "new_log.dat" using 1:3 w l, "new_log.dat" using 1:4 w l, "new_log.dat" using 1:5 w l
