Qliksense Extension Animated Bubble chart Here is the new qliksense extension - bubble chart animated. This is an inspiration from the animation with sliders example of plotly. This is a basic extension quickly created to demonstrate the capability.
<iframe width="560" height="315" src="https://www.youtube.com/embed/siropQVs_GY" frameborder="0" allow="autoplay; encrypted-media" allowfullscreen></iframe>- You can download the extension from the below link. If you like to contribute you can also use the GIT HUB
- Extract and copy contents of the folder in the Extensions folder on your desktop or server. It usually is in the My Documents/Qlik/Sense/Extensions folder
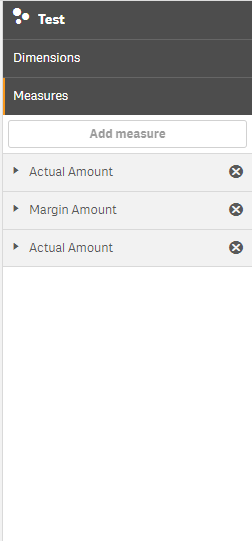
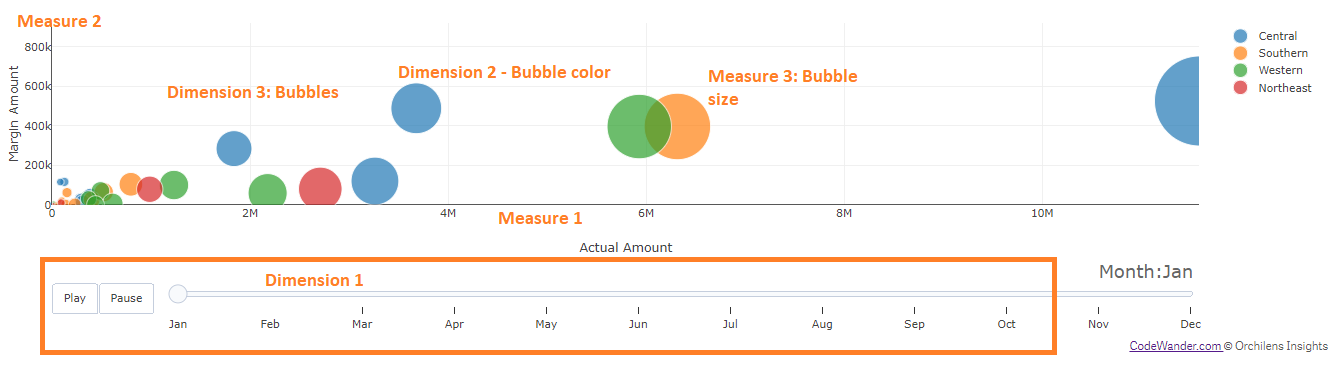
- The first measure the x-axis
- The second measure is the y-axis
- The third measure is the size of the bubble
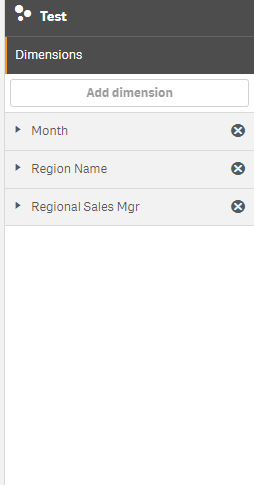
- The first dimension is for the slider
- The second dimension is for color code of the bubble
- The third dimension is the dimension to compute the values of the measures
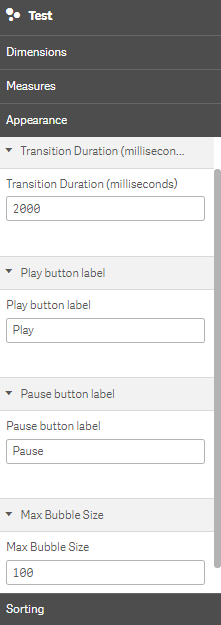 Under Appearance section, you will see the custom options for this visualization
- Transition Duration in milliseconds - This is the duration for the transition from one frame to another frame.
- Play button text
- Pause button text
- Bubble size (25 to 100)
Please use it and share your comments.