This repository is a fork of the FeatureCloud Cluster Visualization App, enhanced to handle .h5ad scRNA-seq data. By integrating UMAP functionality, it can read raw and batch-corrected single-cell data, compute or display UMAP embeddings, and visualize them alongside the original clustering/plot tabs included in the app. The goal is to provide an interactive environment for comparing raw vs. corrected UMAPs while preserving all the standard feature set of the FeatureCloud cluster visualization framework.
- Handles
.h5adsingle-cell data files containing scRNA-seq information. - Computes or reads existing UMAP coordinates from your
.h5adif needed. - Displays side-by-side or combined UMAP views for both raw and batch-corrected data.
- Retains the original Confounders, Distances, Clustering Quality, Scree Plot, and Volcano Plot tabs from the base app.
This is an interactive cluster visualization app implemented in Dash and Plotly.
This app is intended to be used in FeatureCloud environment. It requires input data in order to generate the interactive visualization interface. The data must be in the place and in the format specified by this documentation. The app has a tabular interface consisting of:
- Confounders
- Distances
- Clustering Quality
- Scree plot
- Volcano plot
- Help
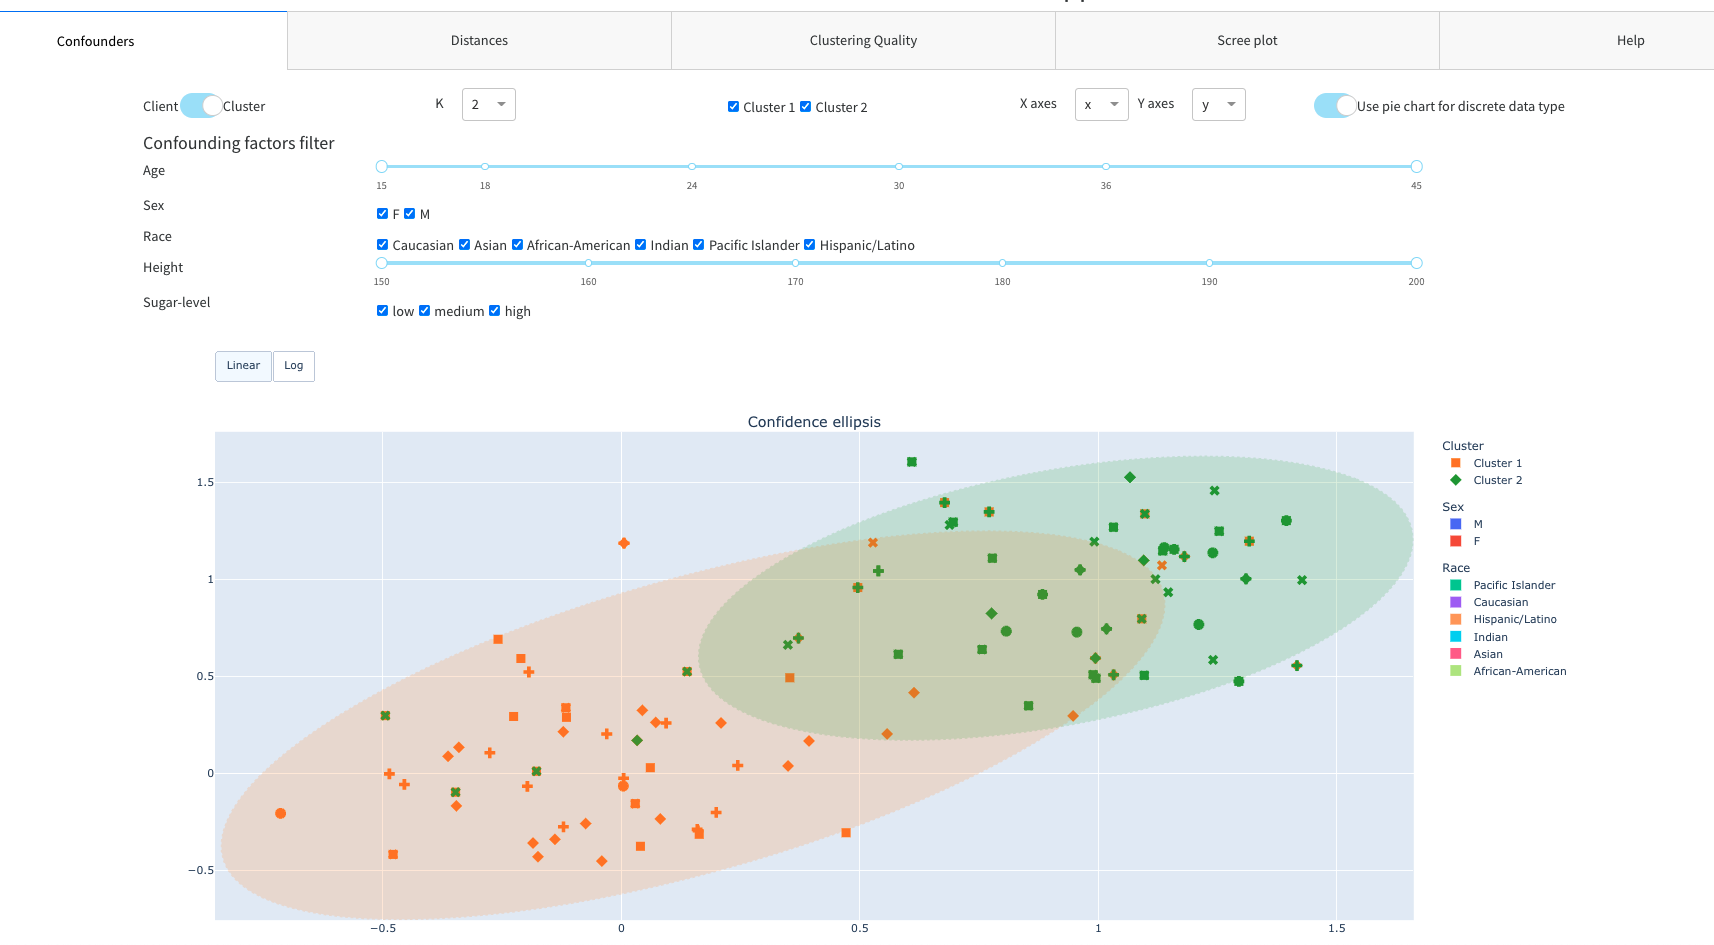
Main features:
- Cluster or client id field based clustering display
- K number selector
- Cluster selector
- X and Y axes selector
- Use pie or bar chart selector for discrete data type visualization
- Confounding factors filter
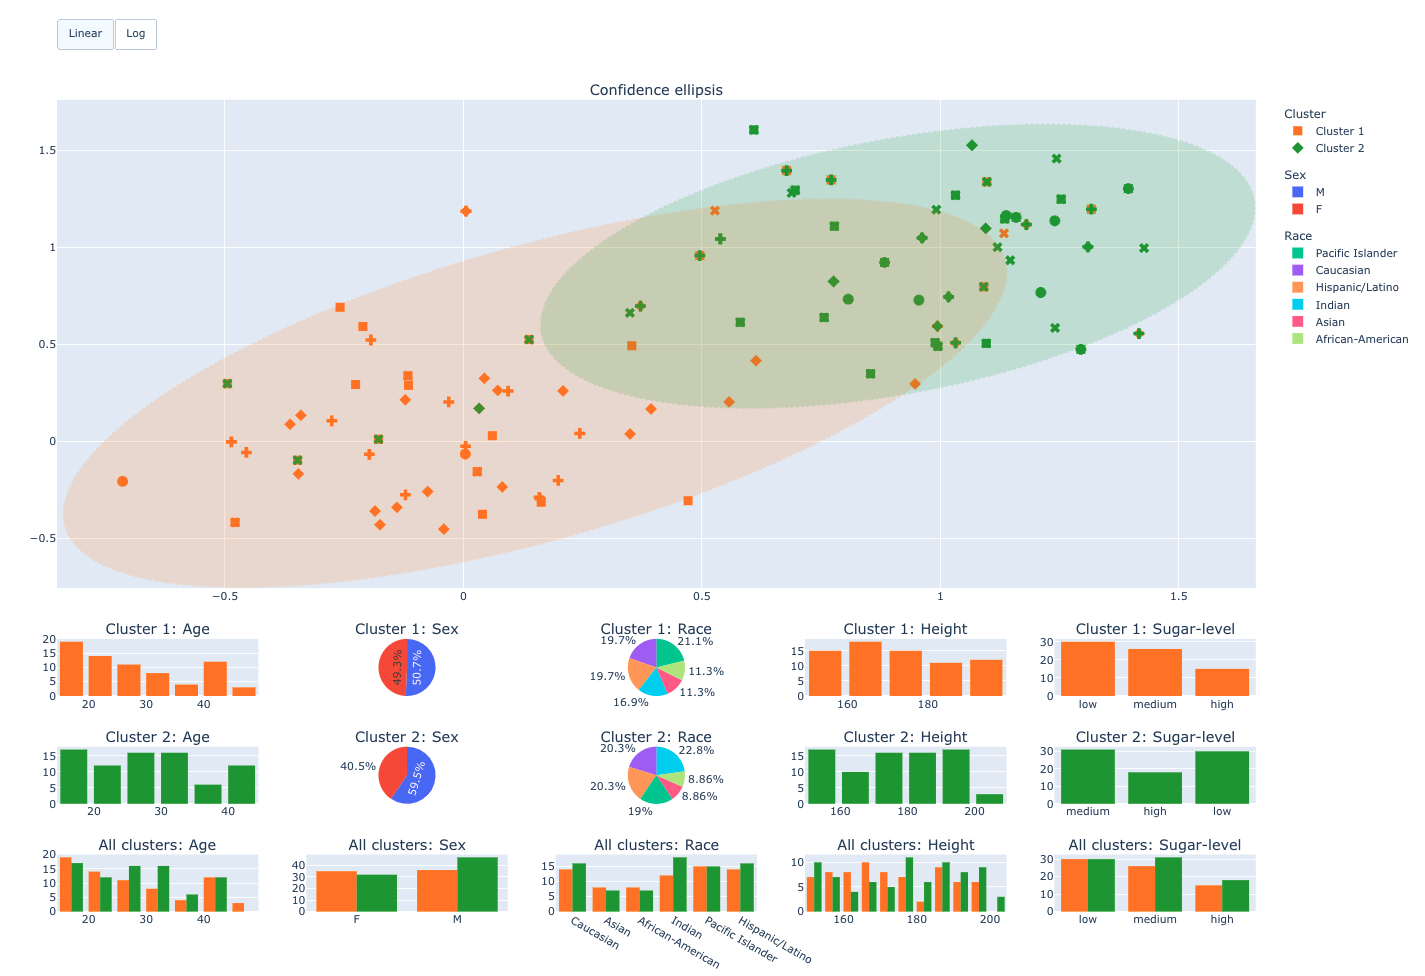
- Scatter plot with confidence ellipsis
- Linear or logarithmic scale
- Point/Lasso/Box selection
- Export diagrams to png
- Confounding factors diagrams
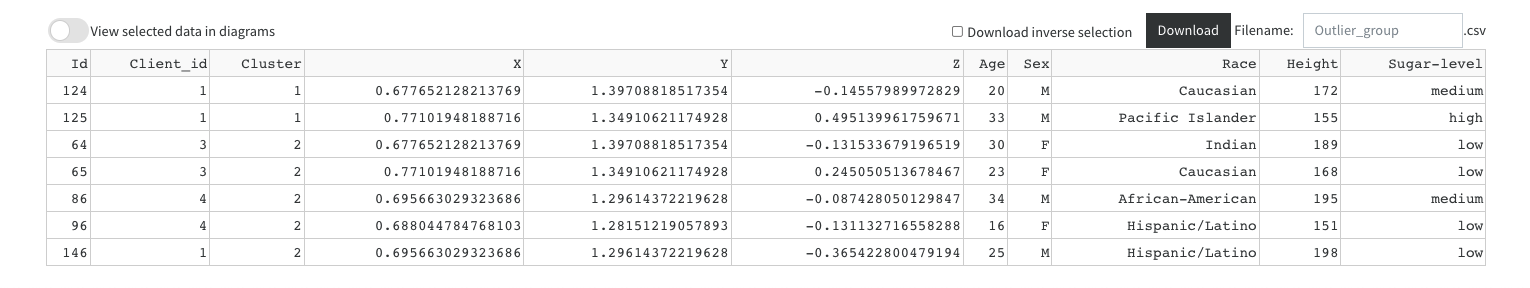
- Visualize and download selected points
Main features:
- K number selector
- Cluster selector
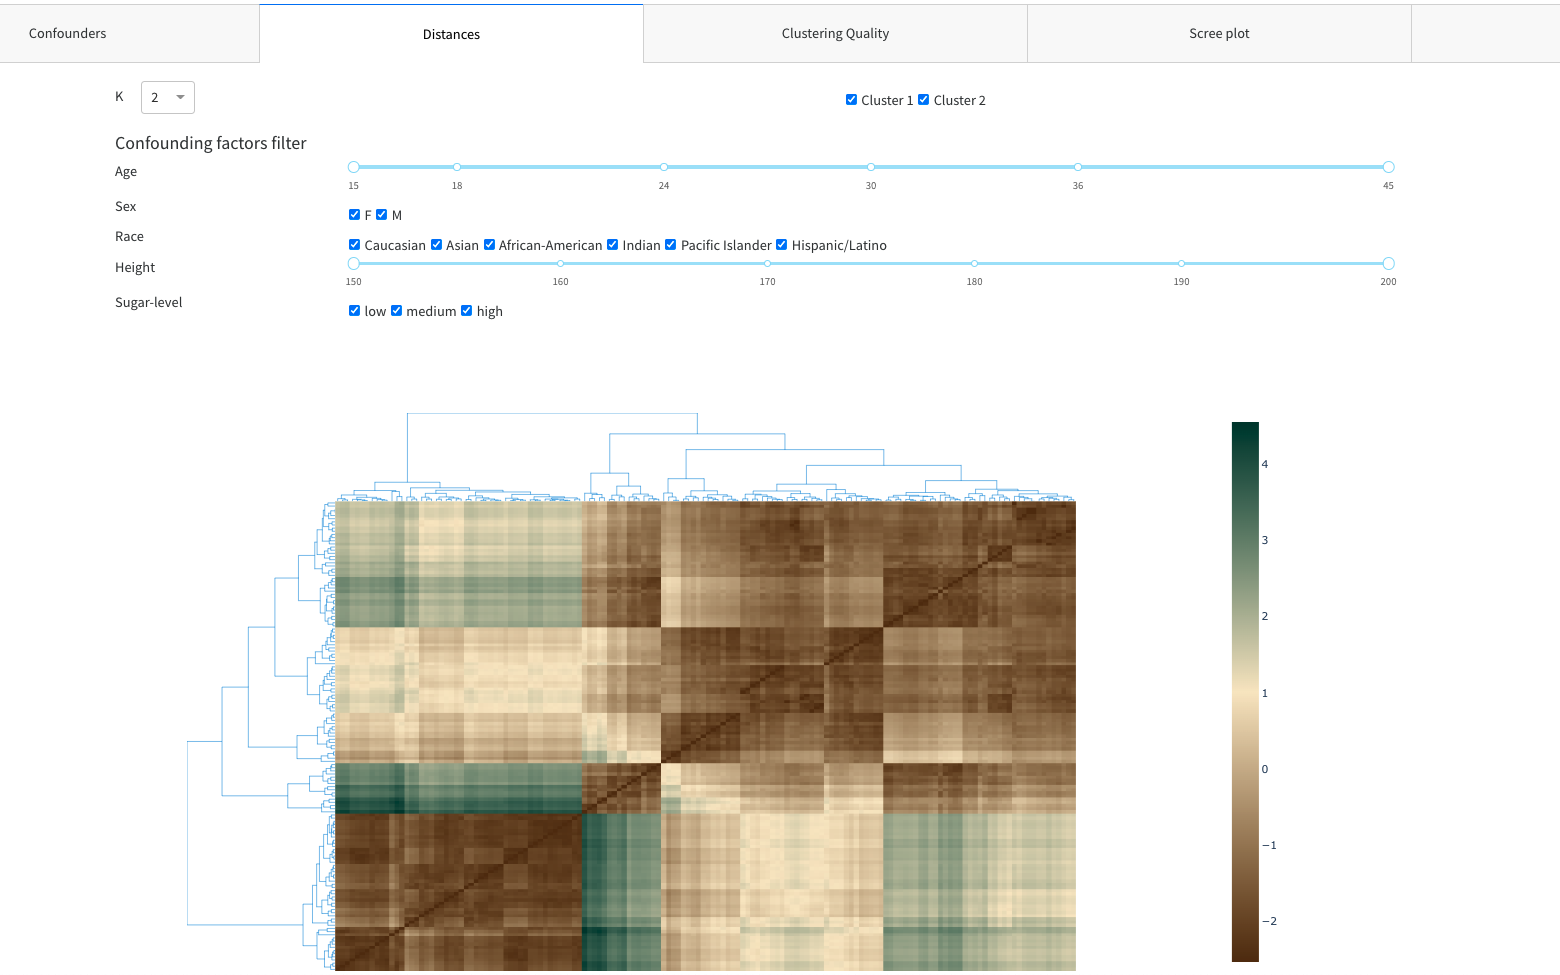
- Confounding factors filter
- Clustergram
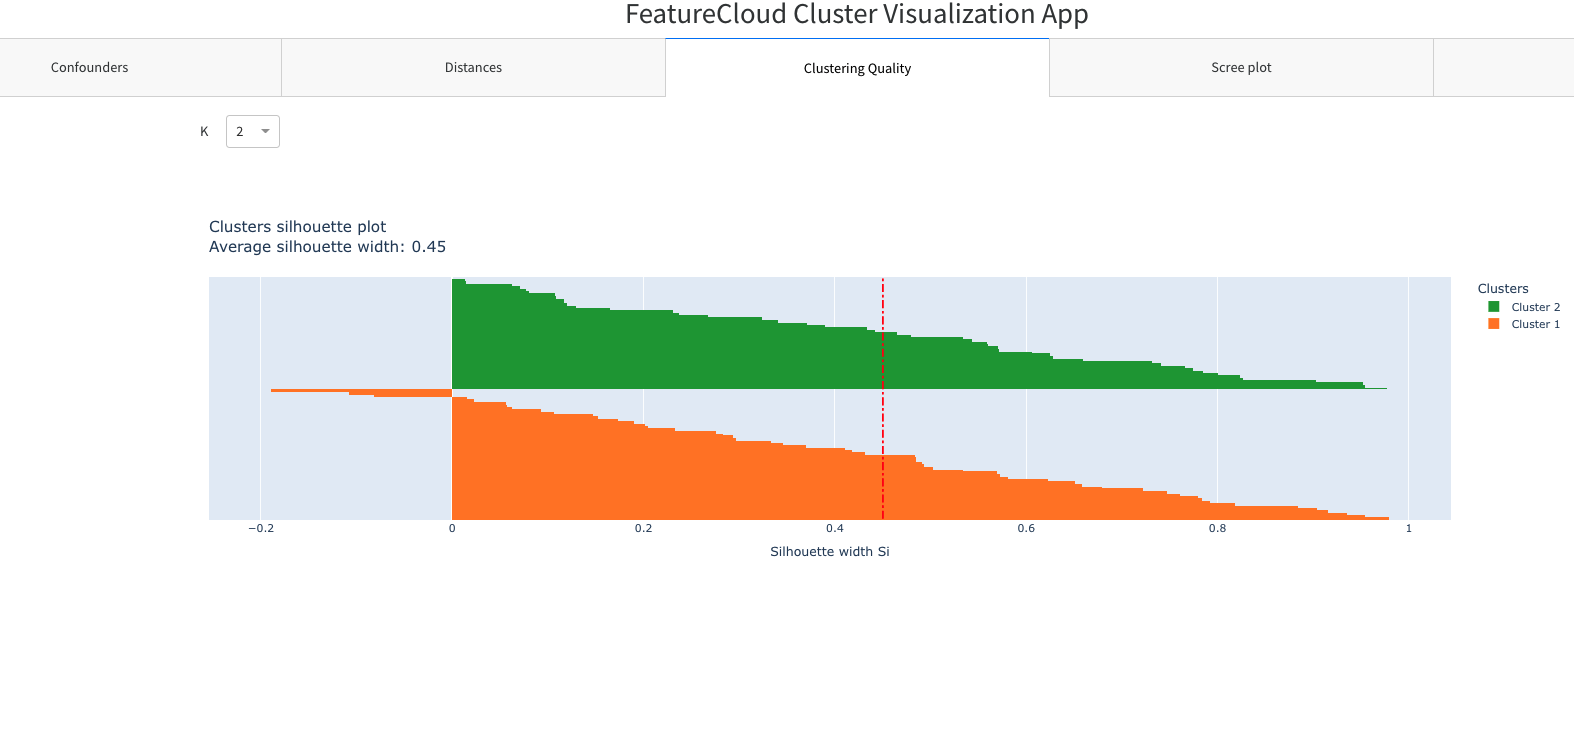
Main features:
- K number selector
- Silhouette plot
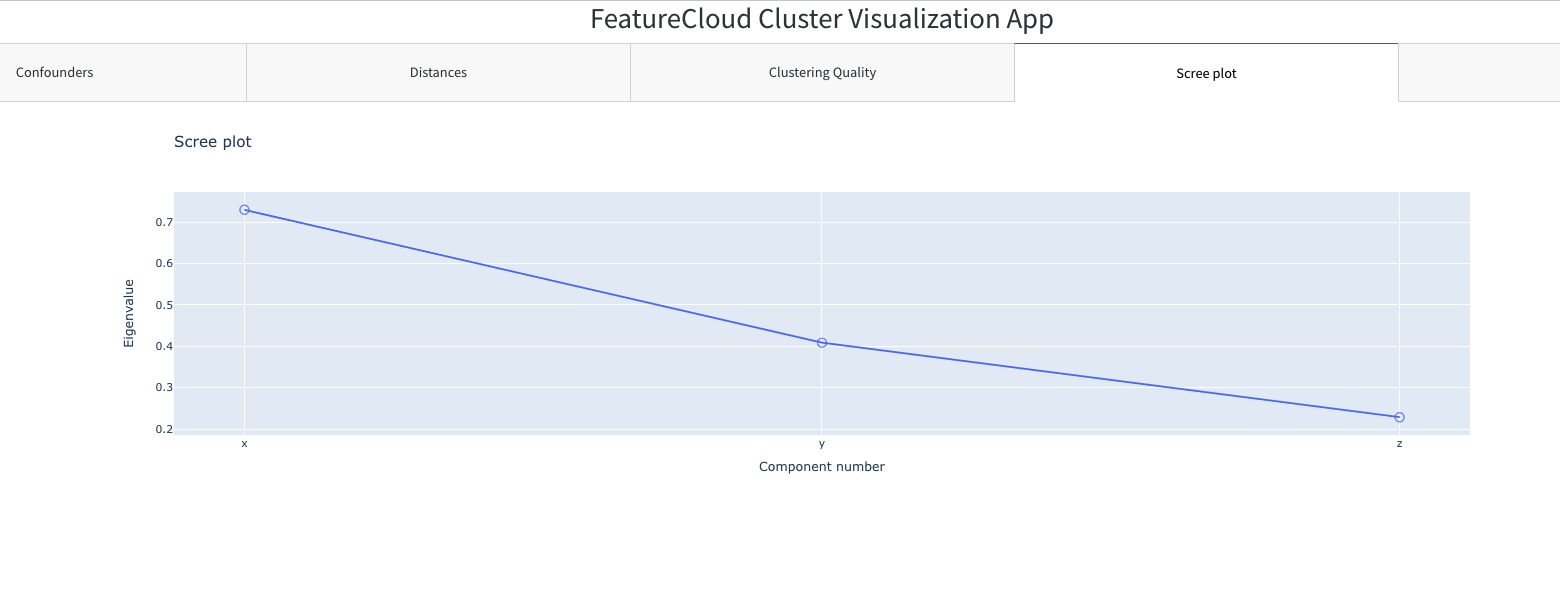
- K number selector
Main features:
- Display components' eigenvalue
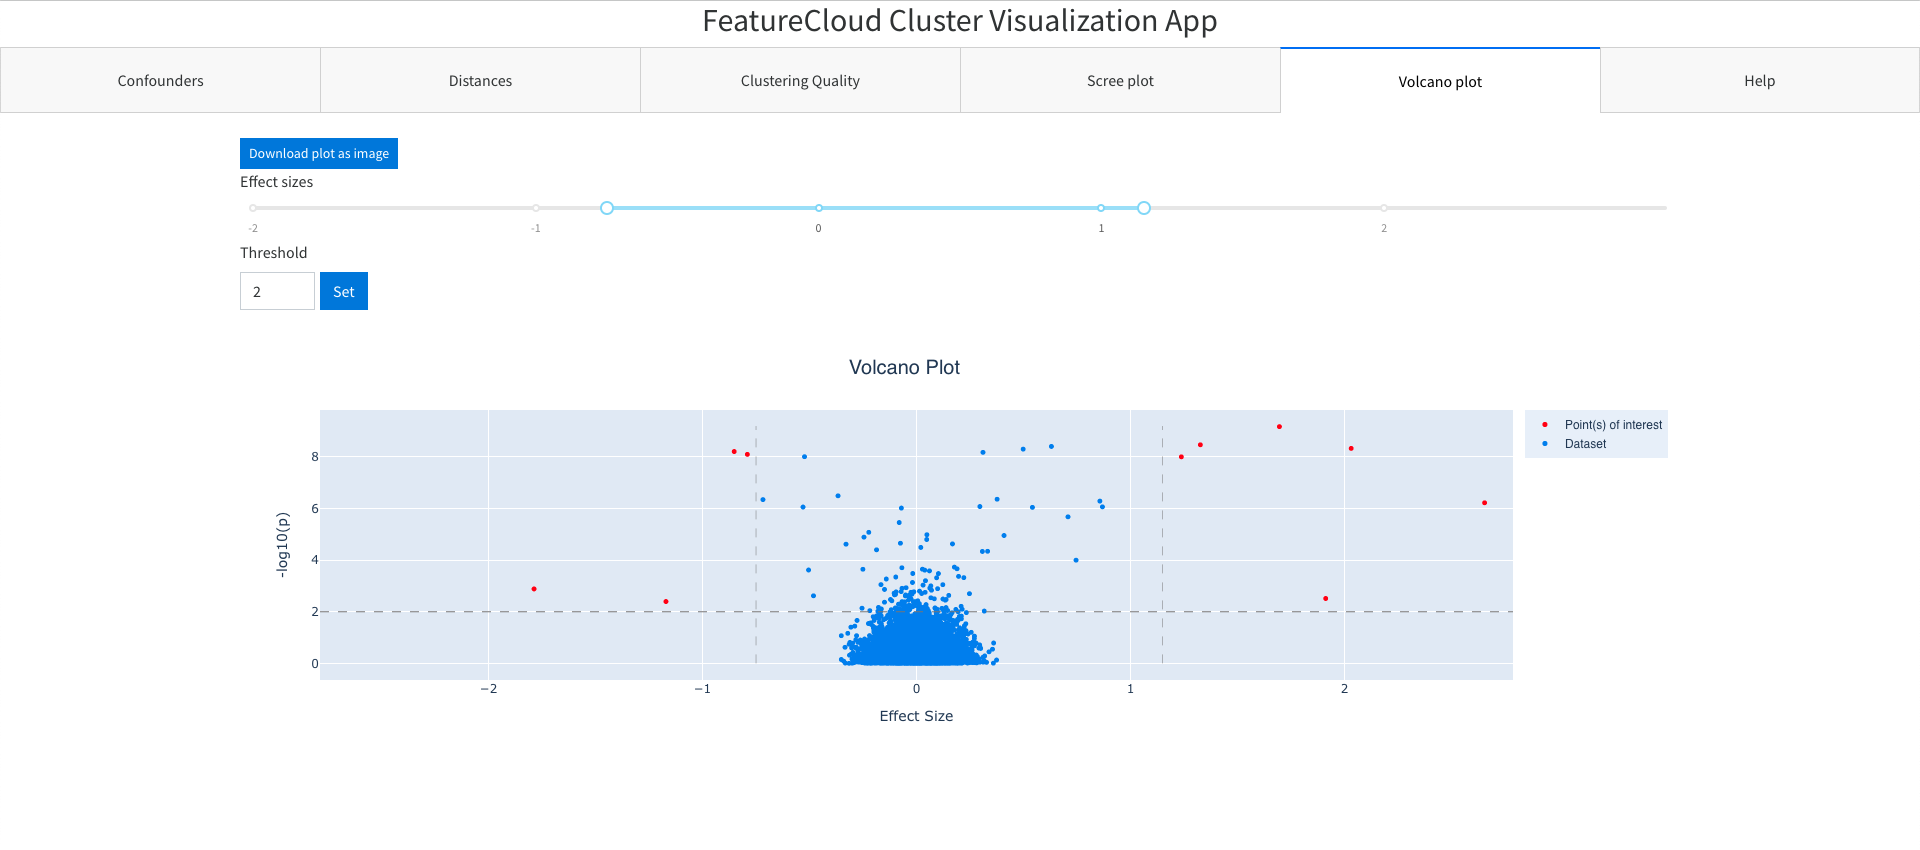
Main features:
- Set effect sizes thresholds (vertical)
- Set genome wide line threshold (horizontal)
It displays this documentation.
data
└───results
│   └───K2
│       │   clustering.csv
│       │   silhouette.csv
│   └───K3
│       │   clustering.csv
│       │   silhouette.csv
│   └───...
│   └───K<n>
│       │   clustering.csv
│       │   silhouette.csv
│   confoundingData.csv
│   confoundingData.meta
│   localData.csv
│   distanceMatrix.csv
│   varianceExplained.csv
|   volcano_data.csv
For a better understanding an example data set can be downloaded by clicking here.
When running the app in a workflow, one can upload a zip file containing the config file and data files. It will be automatically unzipped and copied to the input directory of the app. To test this, just upload the example data set mentioned above. When running the app in a workflow, one can trigger the app to finish, by clicking the Finished button in the top right corner. This makes possible starting the next app in the workflow, if any, or stopping the workflow.
Notes:
- localData.csv file is mandatory. The rest of files are optional.
- All files under K folders (if the folder exists) are mandatory
The default delimiter is the ";" character. It can be overwritten in the config.yml file.
This file contains all confounding factors related to local data. First column is the id (mandatory), followed by a maximum of 5 of columns of confounders. The confounders column names are arbitrary and must not match reserved column names: id, cluster, client_id
id;age;sex;race;height;sugar-level
1;38;F;Caucasian;159;low
2;17;F;Asian;175;low
3;40;F;African-American;162;medium
4;32;F;Indian;183;high
5;18;F;Indian;193;low
This file contains meta information about confounding factors
Columns:
- name: the name of the confounding factor
- data_type:
- continous: arbitrary values
- discrete: values from a predefined value set
- ordinal: values from a predefined value set in ordered manner
- value_type
- integer
- string
- enumeration values in ordered manner
name;data_type;value_type
age;continuous;integer
sex;discrete;string
race;discrete;string
height;continuous;integer
sugar-level;ordinal;low,medium,high
This file contains the base values. Columns:
- id: sample id (mandatory)
- client_id: optional field, the app supports display of clustering on this field as well
- data columns: at least 2 data columns need to be present. More than 2 data columns are supported. The column names are arbitrary and must not match reserved column names: id, cluster, client_id
id;client_id;x;y;z
1;1;-0.115257648318211;0.289555823437292;0.333954194475931
2;1;-0.226069897739012;0.293898393621215;0.130668954544708
3;1;0.0606059327164007;0.0297344961039227;0.112959671444335
4;1;0.0398616396572761;-0.37563056412847;-0.35560909629883
5;1;-0.21084222999711;0.592948181336414;-0.368794747648271
This file contains distances between samples. It is of n x n dimension, where n is the number of sample data.
1;2;3;4;5
1;0;0.53851648071345;0.509901951359278;0.648074069840786;0.141421356237309
2;0.53851648071345;0;0.3;0.331662479035541;0.608276253029822
3;0.509901951359278;0.3;0;0.244948974278318;0.509901951359278
4;0.648074069840786;0.331662479035541;0.244948974278318;0;0.648074069840786
5;0.141421356237309;0.608276253029822;0.509901951359278;0.648074069840786;0
This file contains the eigenvalues for components. Columns:
- component: mandatory field, it contains the name of the component
- eigenvalue: mandatory field, it contains the eigenvalue of the component
component;eigenvalue
x;0.729624454
y;0.408507618
z;0.228507618
This file contains the cluster distribution of the samples. Columns:
- id: mandatory, sample id
- cluster: mandatory, cluster id
id;cluster
1;1
2;1
3;1
4;1
5;1
This file contains data used to display the clusters silhouette plot. Columns:
- index column, mandatory
- y: mandatory, contains the value to be plotted
- cluster: mandatory, contains the cluster id
x;y;cluster
1;0.369499266613275;1
2;0.783307729521766;1
3;0.0627545099705458;1
4;0.205028521828353;1
5;0.915254552382976;1
This file contains data used to display the volcano plot. The columns are the default columns used in Dash Bio Volcano plot library.
CHR;BP;P;SNP;ZSCORE;EFFECTSIZE;GENE;DISTANCE
1;937641;0.335343792801723;rs9697358;0.9634;-0.0946;ISG15;1068
1;1136887;0.245857131900266;rs34945898;1.1605;-0.0947;TNFRSF4;0
1;2116240;0.823285880265757;rs12034613;0.2233;-0.0741;FP7162;0
- the number of samples has to be the same in all files
- the sample ids must be persistent
The app supports setting all data file and directory paths from config file. The config.yml file should be placed in the default data directory (mnt/input/data) Example:
fc-cluster-visualization-app:
  delimiter: ';'
  data-dir: 'data/exampleData'
  local-data-path: 'data/exampleData/localData.csv'
  distance-matrix-path: 'data/exampleData/distanceMatrix.csv'
  confounding-meta-path: 'data/exampleData/confoundingData.meta'
  confounding-data-path: 'data/exampleData/confoundingData.csv'
  variance-explained-path: 'data/exampleData/varianceExplained.csv'
  k-values-clustering-result-dir: 'data/exampleData/results'
  k-values-clustering-file-name: 'clustering.csv'
  k-values-silhouette-file-name: 'silhouette.csv'
  volcano-data-path: 'exampleData/volcano_data.csv'
  # all files downloaded from the browser will end up here too
  download-dir: 'data/exampleData/downloads'
If config file is not present, the app will search for data in the default folder (/mnt/input/data). Any key from the config file can be omitted, in that case the app will search in the default data directory. Keys should not be left with blank values.
- the app supports displaying 5 confounding factors simultaneously
- if more than 5 confounding factors are present in the confoundingMeta.csv file, it will display the first 5
When the app runs in a FeatureCloud workflow, a Finished button will be displayed in the upper right corner. Clicking on the button terminates the application, while the controller shuts down the Docker container. Also, input folder content will be copied to the output folder.
Confounding factors filter with scatter plot
Scatter plot with confounding factors diagrams
View selected data from scatter plot
Clustergram
Silhouette diagram