-
Notifications
You must be signed in to change notification settings - Fork 36
Detailed installation walkthrough
Recovered from Keith's old blog page
- Install the "git" package that we will use to clone the connector binaries from GitHub
# yum -y install git
- Create a new directory or 'cd' into the directory where you want the connector files to reside, I used /opt
# cd /opt
- Clone the connector from GitHub
# git clone https://github.com/Isilon/isilon_data_insights_connector.git
- Install the following two packages with yum that will allow us to install some requirements
# yum -y install epel-release python-pip
- 'cd' into the directory where you installed the connector and use "pip" to install the requirements in the "requirements.txt" file. These are python packages required for the Isilon connector
# pip install -r requirements.txt
- Copy the example config file to make it the real config file in the connector directory
# cp example_isi_data_insights_d.cfg isi_data_insights_d.cfg
- Edit the isi_data_insights_d.cfg file and add your Isilon cluster name(s) to the "clusters:" line. You will need to add the first Isilon cluster name on the SAME line as the "cluster:" string. If you have a second Isilon cluster to monitor, you can add it to the same line with a space in between (like the example below) or with a line break separating the two cluster names. Just make sure the first cluster name is on the same line as the "clusters:" line and things will work.
clusters: demo.keith.com demo7.keith.com
- Configure your yum repository for the influxdb.repo and install influxdb with yum. Edit your Linux /etc/yum.repos.d/influxdb.repo file and add the text:
[influxdb]
name = InfluxDB Repository - RHEL \$releasever
baseurl = https://repos.influxdata.com/rhel/\$releasever/\$basearch/stable
enabled = 1
gpgcheck = 1
gpgkey = https://repos.influxdata.com/influxdb.key
Then run the commands:
yum install -y influxdb
service influxdb start
- Configure your yum repository for the grafana.repo and install grafana with yum. Edit your Linux /etc/yum.repos.d/grafana.repo file and add the text:
[grafana]
name=grafana
baseurl=https://packagecloud.io/grafana/stable/el/6/$basearch
enabled=1
gpgcheck=1
gpgkey=https://packagecloud.io/gpg.key https://grafanarel.s3.amazonaws.com/RPM-GPG-KEY-grafana
Then run the commands:
yum install -y grafana
service grafana-server start
- Start the Isilon Data Insights Connector with the python script below and enter the root user credentials for each Isilon cluster when prompted. You can optionally configure the credentials in the isi_data_insights_d.cfg file in the "clusters:" line, see the notes in the cfg file comments. Also you can decide if you'd like to use SSL for the connection, I am choosing "No" in my example. If successful, your output should look similar to what I've posted below.
# ./isi_data_insights_d.py start
Please provide the username used to access demo.keith.com via PAPI: root
Password:
Verify SSL cert [y/n]: n
Configured demo.keith.com as version 8 cluster, using SDK isi_sdk_8_0.
Please provide the username used to access demo7.keith.com via PAPI: root
Password:
Verify SSL cert [y/n]: n
Configured demo7.keith.com as version 7 cluster, using SDK isi_sdk_7_2.
Computing update intervals for stat group: cluster_cpu_stats.
Computing update intervals for stat group: cluster_network_traffic_stats.
Computing update intervals for stat group: cluster_client_activity_stats.
Computing update intervals for stat group: cluster_health_stats.
Computing update intervals for stat group: ifs_space_stats.
Computing update intervals for stat group: ifs_rate_stats.
Computing update intervals for stat group: node_load_stats.
Computing update intervals for stat group: cluster_disk_rate_stats.
Computing update intervals for stat group: cluster_proto_stats.
Computing update intervals for stat group: cache_stats.
Computing update intervals for stat group: heat_total_stats.
Configured stat set:
  Clusters: [demo, demo7]
  Update Interval: 300
  Stat Keys: set(['ifs.percent.free', 'ifs.bytes.free', 'ifs.bytes.used', 'ifs.bytes.avail', 'ifs.bytes.total', 'ifs.percent.avail', 'ifs.percent.used'])
Configured stat set:
  Clusters: [demo, demo7]
  Update Interval: 30
  Stat Keys: set(['cluster.protostats.lsass_out.total', 'node.open.files', 'cluster.protostats.siq.total', 'node.clientstats.connected.ftp', 'cluster.net.ext.bytes.out.rate', 'node.clientstats.active.smb2', 'cluster.protostats.siq', 'cluster.protostats.irp.total', 'ifs.ops.out.rate', 'node.clientstats.connected.cifs', 'cluster.cpu.idle.avg', 'cluster.net.ext.packets.out.rate', 'node.ifs.heat.rename.total', 'ifs.bytes.out.rate', 'cluster.protostats.irp', 'node.load.5min', 'node.memory.used', 'cluster.protostats.nlm.total', 'node.clientstats.active.hdfs', 'node.clientstats.connected.nlm', 'cluster.protostats.nfs4.total', 'cluster.protostats.nlm', 'node.ifs.heat.read.total', 'node.clientstats.active.nlm', 'cluster.health', 'cluster.disk.bytes.out.rate', 'cluster.disk.bytes.in.rate', 'node.ifs.heat.link.total', 'cluster.protostats.papi.total', 'node.ifs.heat.setattr.total', 'cluster.protostats.smb2.total', 'cluster.protostats.jobd', 'cluster.net.ext.packets.in.rate', 'cluster.protostats.lsass_out', 'cluster.protostats.hdfs.total', 'node.clientstats.connected.hdfs', 'cluster.disk.xfers.in.rate', 'node.clientstats.active.nfs4', 'node.clientstats.active.ftp', 'node.ifs.heat.deadlocked.total', 'cluster.protostats.nfs4', 'node.clientstats.connected.papi', 'node.ifs.cache', 'cluster.protostats.lsass_in.total', 'node.ifs.heat.lock.total', 'cluster.net.ext.errors.out.rate', 'node.clientstats.connected.siq', 'node.clientstats.active.lsass_out', 'node.ifs.heat.write.total', 'node.clientstats.active.cifs', 'cluster.protostats.nfs', 'cluster.node.count.all', 'node.load.15min', 'cluster.protostats.cifs', 'node.clientstats.active.nfs', 'cluster.net.ext.bytes.in.rate', 'cluster.protostats.nfs.total', 'node.ifs.heat.getattr.total', 'node.ifs.heat.unlink.total', 'cluster.protostats.http', 'node.ifs.heat.blocked.total', 'node.clientstats.active.jobd', 'cluster.protostats.hdfs', 'cluster.protostats.cifs.total', 'cluster.protostats.ftp', 'node.clientstats.active.http', 'node.load.1min', 'cluster.node.count.down', 'cluster.cpu.intr.avg', 'ifs.ops.in.rate', 'cluster.protostats.lsass_in', 'node.memory.cache', 'cluster.cpu.user.avg', 'cluster.disk.xfers.out.rate', 'cluster.protostats.http.total', 'cluster.disk.xfers.rate', 'node.clientstats.active.siq', 'cluster.net.ext.errors.in.rate', 'cluster.protostats.ftp.total', 'cluster.cpu.sys.avg', 'node.ifs.heat.contended.total', 'cluster.protostats.jobd.total', 'node.ifs.heat.lookup.total', 'cluster.protostats.smb2', 'node.clientstats.active.papi', 'node.clientstats.connected.http', 'ifs.bytes.in.rate', 'node.clientstats.connected.nfs', 'cluster.protostats.papi', 'node.memory.free', 'node.cpu.throttling'])
Everything is up and running and we now need to configure Grafana to set the InfluxDB database as a data source and then import the four prebuilt sample dashboards.
-
Log into Grafana which is port 3000 of the Linux VM (https://ip.address:3000). The default login and password are "admin".
-
Grafana will automatically ask to create a data source. See the screenshot below, the data source should be type "InfluxDB" and the database name is "isi_data_insights". The other options are captured in the screenshot, we are using basic authentication with no credentials (you can change this later if you like).
Screenshot - Configure Grafana Data Source

-
Download the zip file of the Isilon Data Insights Connector to your host/laptop that is connecting to the Grafana web page. Extract the zip file and find the four (4) prebuilt dashboards which are the four JSON files. Note the location of the four JSON files for the next step.
-
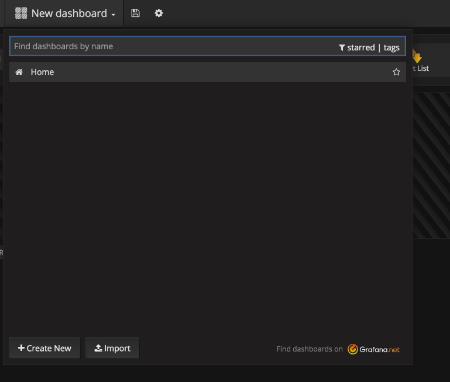
Import the four JSON files into four dashboards. Click on the "new dashboard" button in the upper left hand corner of the Grafana page and select the "Import" button at the bottom.
Screenshot - New Dashboard - Import

Click the "Upload .json File" button a browse the the first of the four JSON files in the zip file from step #3. Repeat for all four JSON files below:
grafana_ cluster_capacity_utiltization_dashboard.json grafana_cluster_detail_dashboard.json grafana_cluster_list_dashboard.json grafana_cluster_protocol_dashboard.json
Screenshot - Upload .json file

- You are done! Pull up each dashboards to test and look at your clusters. At first there will be no data, you will need to wait a few minutes for statistics to start populating the database (hint - refresh every 30 seconds in the upper right hand corner to start seeing data immediately).
Screenshot - Prebuilt Dashboards after import

The four prebuilt dashboards give you the ability to do advanced cluster and performance monitoring without doing any customization.
Isilon Data Insight Cluster Summary Single pane of glass view to all your clusters on a single screen with a few key real time metrics for monitoring total nodes, nodes down, alert status, cpu, capacity, NFS throughput/ops/latency, and SMB throughput/ops/latency with a user defined refresh rate.
Isilon Data Insights Cluster Detail Detailed view of a single cluster with metrics for CPU, capacity utilization, protocol ops, client connections, open files, network traffic, filesystem throughput, disk throughput, network errors, job engine activity, filesystem events, and cache stats. The dashboard can be used for real time monitoring with a user defined refresh rate or can be used to go back and look at historical data. Both options are defined in the upper right hand corner with a time range and refresh rate.
Isilon Data Insights Cluster Capacity Utilization Table Single view of all clusters capacity utilization level. Great for monitoring your clusters when they are approaching 90-95% full.
Isilon Data Insights Protocol Detail Detailed view of single cluster protocol details. Can filter on selected protocol (SMB/NFS/FTP/FTP/PAPI/SyncIQ) and get very detailed information including protocol connections, protcol ops graphed against cluster CPU, protocol operational mix, throughput, latency. Again, this dashboard can monitor real time stats or go back in time and do a detailed analysis of historical data.
This is probably what you have been waiting for, how do you edit and customize one of the prebuilt dashboards or even build your own? I won't go into every detail but its pretty easy to do since you have access to edit and change everything in the prebuilt dashboards.
Let's take a look at one of the charts to see how a graph as constructed. I'm going to look at "Cluster SMB Operations and CPU" which charts SMB2 operations per second and correlates to the cluster CPU utilization (part of the Isilon Data Insights Protocol Detail dashboard). Every dashboard and graph can be edited to show how the graph was built in Grafana. Just click the graph and a menu pops up above it (screenshot below), select "Edit".
Screenshot - Cluster SMB2 Operations and CPU

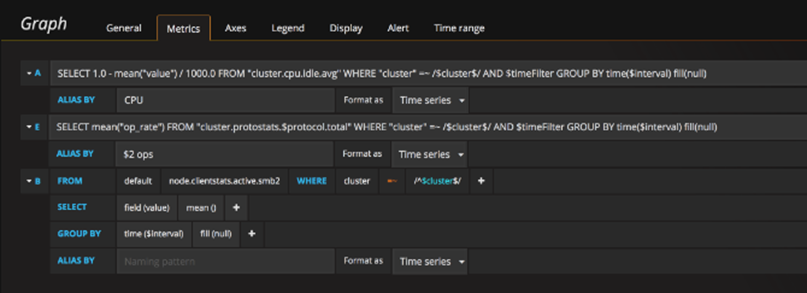
Once you edit a graph you will see the SELECT FROM WHERE type query that was used to query the InfluxDB database and built the graph. Below you will see two SELECT statements that were used for the SMB OPS and CPU correlation. The first query was used for the CPU utilization and the second was used for the SMB ops chart.
Screenshot - Graph Metrics

What if I wanted to add a third query to this existing graph? All I need to do is click the "+Add query" button and then create my own SQL query from the interface. I'm going to add a very simple query for "node.clientstats.active.smb2" to also graph the active SMB clients against the SMB ops and CPU. See the screenshot for my added query.
Screenshot - Add a third query to an existing graph

If I close out the graph metric interface (X on the right) and go back to my main protocol dashboard, I can now see the graph now has three metrics including the active SMB clients I added in my query (screenshot below).
Screenshot - SMB ops and CPU with active clients

Pretty easy right? Getting the SQL queries takes a bit of work and the best way to build your own queries is to copy those that were already used to build the prebuilt dashboards. You can even manually run SQL queries from the Linux command line, simply use the InfluxDB interface (type 'influx' and 'help').
Isilon InsightIQ is the preferred and supported product for Isilon cluster performance monitoring. But what if you want the ability to manage all of your Isilon performance data in an open source database and have full access to create your own visualization dashboards? Then look at the Isilon Data Insight Connector project and use the steps above to build your own Linux VM with this connector, InfluxDB, and Grafana for full control of your Isilon monitoring and performance statistics. The solution is very easy to use and offers many possibilities to create custom queries and dashboard views without writing any code and using open source products. Please provide feedback through the GitHub page for any issues, this will help the community and keep communications central to GitHub. Thanks for reading, comments welcome!