

A lightweight pure python module for scientific analysis and visualization of 3D objects
and point clouds based on VTK and numpy.
Inspired by the vpython manifesto "3D programming for ordinary mortals", vtkplotter makes it easy to work wth three-dimensional objects, create displays and animations in just a few lines of code, even for those with less programming experience.
Because life is short.
Use pip to install:
pip install -U vtkplotteror use conda to install from the conda-forge channel:
conda install -c conda-forge vtkplotter
Windows-10 users can place this file vtkplotter.bat on the desktop to drag&drop files to visualize. (Need to edit the path of the local python installation).
Automatically generated documentation can be found here.
Have any question, or wish to suggest or ask for a missing feature? Do not hesitate to open a issue or send an email.
Intuitive and straightforward API which can be combined with VTK seamlessly in a program, whilst mantaining access to the full range of VTK native classes.
It includes a large set of working examples for a wide range of functionalities (click triangle to expand...):
working with polygonal meshes and point clouds
- Import meshes from VTK format, STL, Wavefront OBJ, 3DS, Dolfin-XML, Neutral, GMSH, OFF, PCD (PointCloud),

- Export meshes as ASCII or binary to VTK, STL, OBJ, PLY ... formats.

- Analysis tools like Moving Least Squares, mesh morphing and more..

- Tools to visualize and edit meshes (cutting a mesh with another mesh, slicing, normalizing, moving vertex positions, etc..).

- Split mesh based on surface connectivity. Extract the largest connected area.

- Calculate areas, volumes, center of mass, average sizes etc.

- Calculate vertex and face normals, curvatures, feature edges. Fill mesh holes.

- Subdivide faces of a mesh, increasing the number of vertex points. Mesh simplification.

- Coloring and thresholding of meshes based on associated scalar or vectorial data.

- Point-surface operations: find nearest points, determine if a point lies inside or outside of a mesh.

- Create primitive shapes: spheres, arrows, cubes, torus, ellipsoids...

- Generate glyphs (associate a mesh to every vertex of a source mesh).

- Create animations easily by just setting the position of the displayed objects in the 3D scene. Add trailing lines and shadows to moving objects is supported.

- Straightforward support for multiple sync-ed or independent renderers in  the same window.

- Registration (alignment) of meshes with different techniques.

- Mesh smoothing.

- Delaunay triangulation in 2D and 3D.

- Generate meshes by joining nearby lines in space.

- Find the closest path from one point to another, travelling along the edges of a mesh.

- Find the intersection of a mesh with lines, planes or other meshes.

- Interpolate scalar and vectorial fields with Radial Basis Functions and Thin Plate Splines.

- Add sliders and buttons to interact with the scene and the individual objects.

- Visualization of tensors.

- Analysis of Point Clouds:

 - Moving Least Squares smoothing of 2D, 3D and 4D clouds

 - Fit lines, planes, spheres and ellipses in space

 - Identify outliers in a distribution of points

 - Decimate a cloud to a uniform distribution.
working with volumetric data
- Import data from VTK format volumetric TIFF stacks, DICOM, SLC, MHD and more

- Import 2D images as PNG, JPEG, BMP

- Isosurfacing of volumes

- Composite and maximum projection volumetric rendering

- Generate volumetric signed-distance data from an input surface mesh

- Probe a volume with lines and planes

- Generate stream-lines and stream-tubes from vectorial fields

- Slice and crop volumes

- Support for other volumetric structures (structured and grid data)
plotting and histogramming
- Fully customizable axis styles
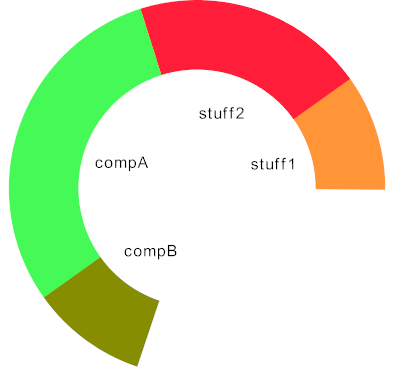
- 'donut' plots and pie charts
- Scatter plots in 2D and 3D
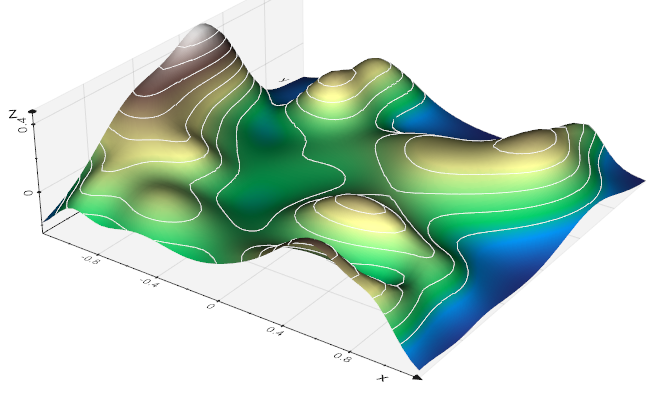
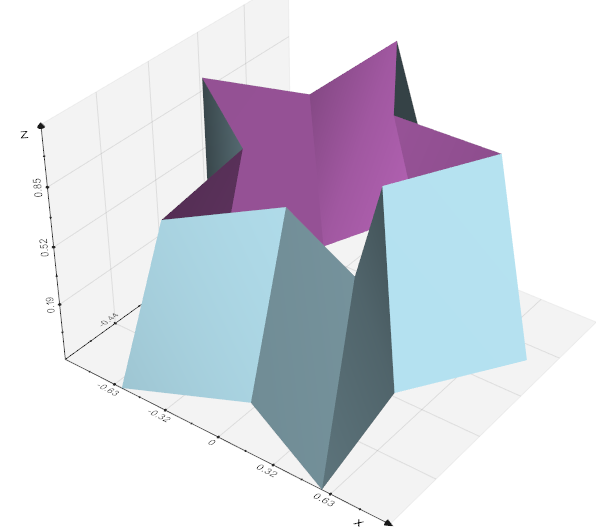
- Surface function plotting
- 1D customizable histograms
- 2D hexagonal histograms
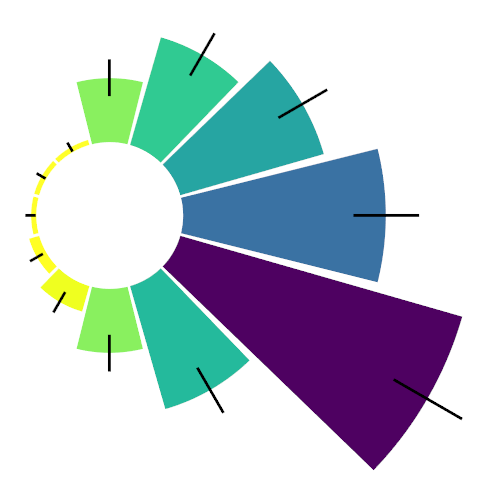
- Polar plots, spherical plots and histogramming
- Draw latex-formatted formulas in the rendering window.
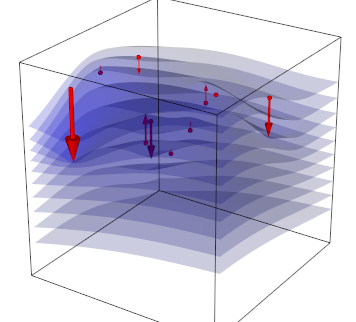
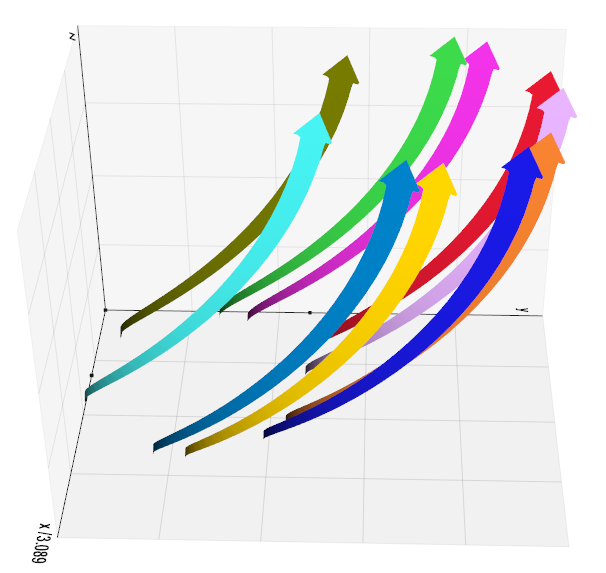
- Quiver plots
- Stream line plots
- Point markers analogous to matplotlib
Moreover:
- Integration with the Qt5 framework.
- Examples using SHTools package for spherical harmonics expansion of a mesh shape.
- Support for FEniCS/Dolfin platform for visualization of finite-element calculations.
- Interoperability with the trimesh library.
- Export a 3D scene and embed it into a web page.
- Embed the 3D rendering in a jupyter notebook with K3D (can export an interactive 3D-snapshot page here).
Visualize a polygonal mesh from a terminal window with:
vtkplotter mesh.obj
# valid formats: [vtk,vtu,vts,vtp,vtm,ply,obj,stl,3ds,dolfin-xml,neutral,gmsh,
#                 pcd,xyz,txt,byu,tif,off,slc,vti,mhd,dcm,dem,nrrd,nii,bmp,png,jpg]
Voxel-data (mhd, vti, slc, tiff, dicom etc..) files can be visualized with options:
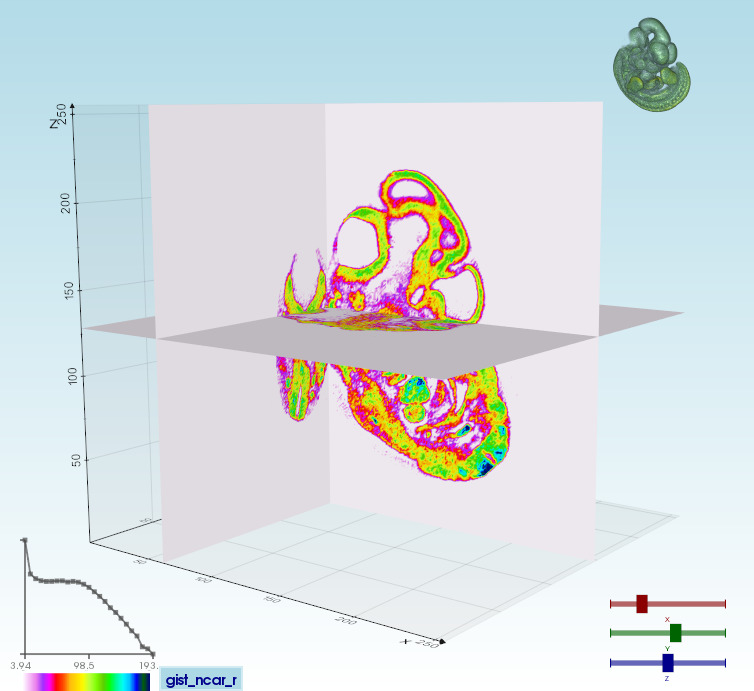
Use sliders to slice a volume in the 3 planes:vtkplotter --slicer embryo.slc |
Ray-casting rendering:vtkplotter -g embryo.slc |
|---|---|
 |
 |
To visualize multiple files or files time-sequences try -n or -s options. Use -h for the complete list of options.
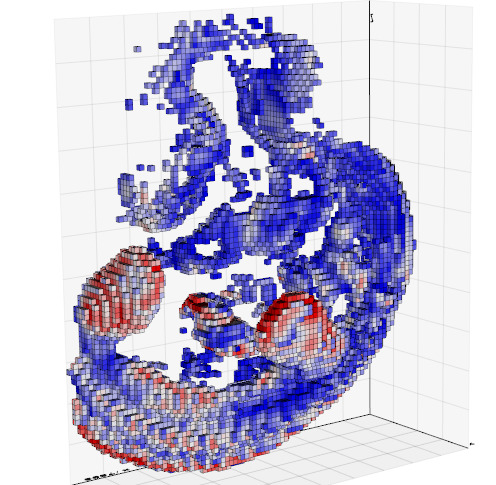
| Interactive volume isosurfacing: | Load and browse a sequence of meshes: | Slice a 3D volume with a plane: | Visualize colorized voxels: |
|---|---|---|---|
vtkplotter head.vti |
vtkplotter -s *.vtk |
vtkplotter --slicer2d em.slc |
vtkplotter --lego embryo.slc |
 |
 |
 |
 |
A GUI is available (mainly useful to *Windows 10* users)

More than 300 working examples can be found in directories (scroll down to see thumbnails):
examples/basic
examples/advanced
examples/volumetric
examples/simulations
examples/pyplot
examples/other
examples/other/dolfin
examples/other/trimesh
examples/notebooks.
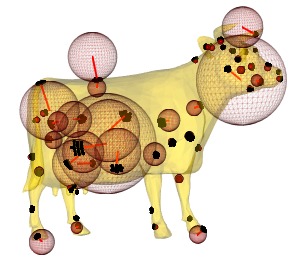
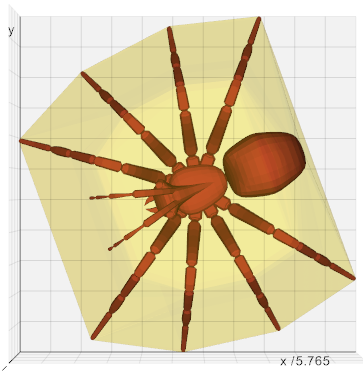
Apply a Moving Least Squares algorithm to obtain a smooth surface from a to a large cloud of scattered points in space (script) |
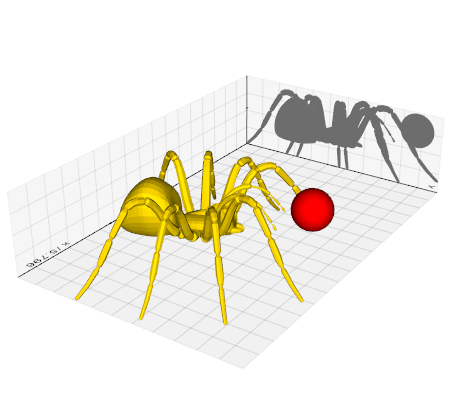
 Create a simple 3D animation in exactly 10 lines of code (script). Trails and shadows can be added to moving objects easily. |
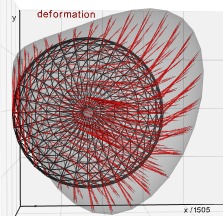
Simulation of a gyroscope hanging from a spring (script). |
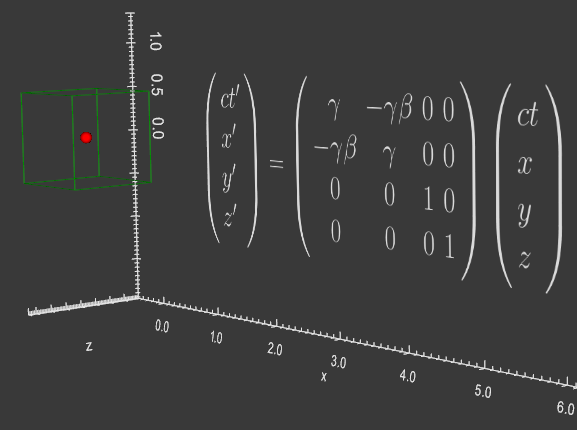
 Quantum-tunnelling effect integrating the Schroedinger equation with 4th order Runge-Kutta method. The animation shows the evolution of a particle in a box hitting a sinusoidal potential barrier. (script) |
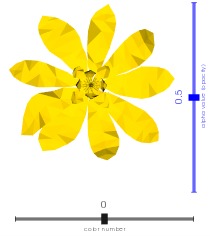
Visualizing a Turing system of reaction-diffusion between two molecules1 (script)  |
 Support for the FEniCS/Dolfin platform for visualization of PDE and finite element solutions (see here) |
Run any of the built-in examples from command line, e.g.:
vtkplotter -ir grayscott

More examples (press spacebar to continue or F1 to interrupt execution):
vtkplotter --list
 covid19 |
 lineage_graph |
 silhouette1 |
 isolines |
 gyroscope2 |
 thinplate_grid |
 trail |
 quadratic_morphing |
 shrink |
 mesh_custom |
 spring |
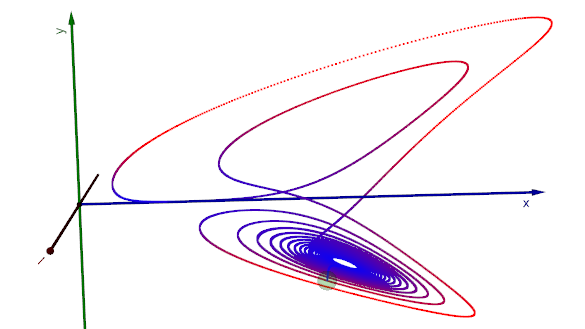 lorentz |
 sliders |
 fitspheres1 |
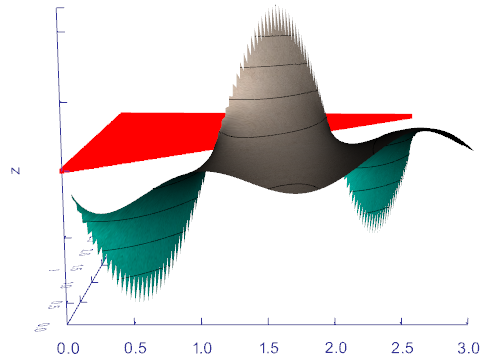 plot4_fxy |
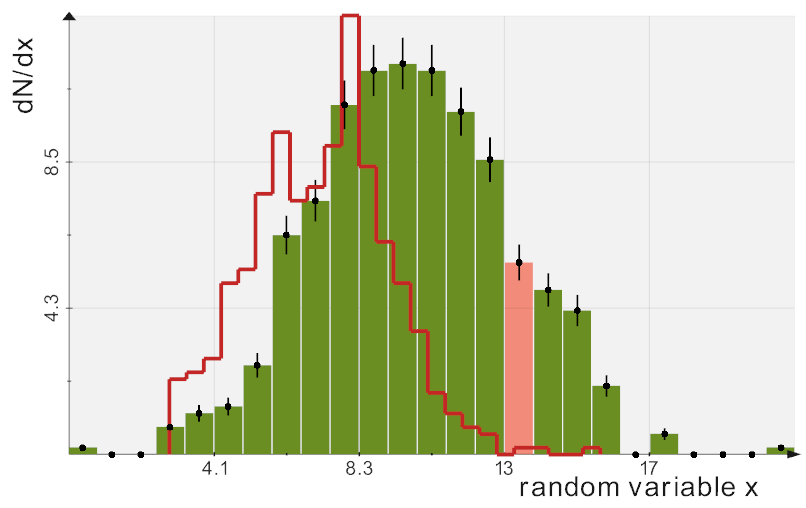 histo_1D |
 plot2_errband |
 histo_2D |
 histo_hexagonal |
 plot5_spheric |
 boolean |
 brownian2D |
 gas |
 self_org_maps2d |
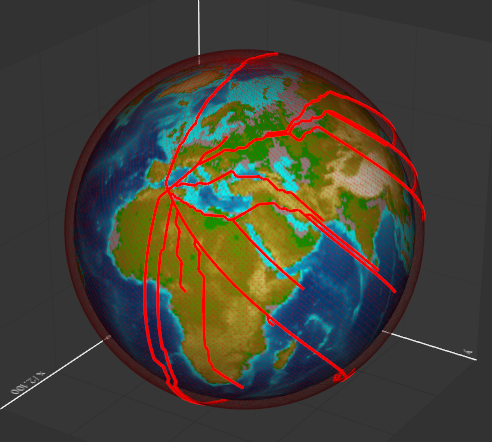 geodesic |
 convexHull |
 flatarrow |
 latex |
 legosurface |
 streamlines2 |
 office.py |
 value-iteration |
 shadow |
 multiple_pend |
 interpolateVolume |
 histo_polar |
 plot7_stream |
 histo_violin |
 plot3_pip |
 histo_spheric |
 |
 donut |
 extrude |
 plot1_errbars |
 particle_simulator |
 heatconv |
 elastodynamics |
 stokes_lshape |
-
M. Musy, G. Dalmasso, J. Sharpe and N. Sime, "
vtkplotter: plotting in FEniCS with python", (link). Poster at the FEniCS'2019 Conference, Carnegie Institution for Science Department of Terrestrial Magnetism, Washington DC, June 2019. -
G. Dalmasso, "Evolution in space and time of 3D volumetric images". Talk at the Conference for Image-based Modeling and Simulation of Morphogenesis. Max Planck Institute for the Physics of Complex Systems, Dresden, Germany, March 2019.
Scientific publications using vtkplotter so far:
- X. Diego et al.: "Key features of Turing systems are determined purely by network topology", Physical Review X, 20 June 2018.
- M. Musy, K. Flaherty et al.: "A Quantitative Method for Staging Mouse Limb Embryos based on Limb Morphometry", Development, 5 April 2018, doi: 10.1242/dev.154856.
- G. Dalmasso et al., "Evolution in space and time of 3D volumetric images", in preparation.
- F. Claudi, A. L. Tyson, T. Branco, "Brainrender. A python based software for visualisation of neuroanatomical and morphological data." bioRxiv 2020.02.23.961748; doi: https://doi.org/10.1101/2020.02.23.961748
Have you found this software useful for your research? Please cite it as:
M. Musy et al.
"vtkplotter, a python module for scientific visualization and analysis of 3D objects
and point clouds based on VTK (Visualization Toolkit)",
Zenodo, 10 February 2019, doi: 10.5281/zenodo.2561402.
