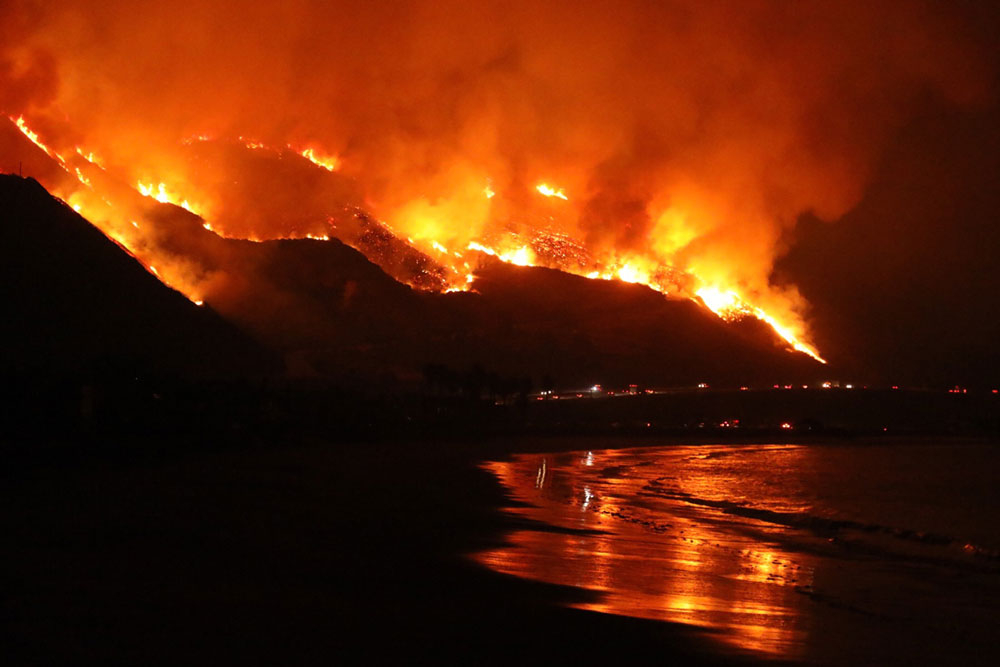
Geospatial data analysis & visualization in Python (Jupyter Notebooks) of California's Thomas Fire (December 2017)
Author: Anna Ramji @a-ramji | [email protected]
Read more about this project on my blog
This repository contains a Jupyter Notebook of my analysis and visualization of three key datasets related to the Thomas Fire.
- The first dataset is Air Quality Index (AQI) data from the US Environmental Protection Agency to visualize the impact on the AQI of the 2017 Thomas Fire in Santa Barbara County
- The second is a simplified collection of bands (red, green, blue, near-infrared and shortwave infrared) from the Landsat Collection 2 Level-2 atmosperically corrected surface reflectance data, collected by the Landsat 8 satellite. This data that was accessed and pre-processed in Microsoft's Planetary Computer to remove data outside land and coarsen the spatial resolution (Landsat Collection in MPC) by Professor Carmen Galaz-García (@carmengg on GitHub)
- The third dataset is A shapefile of fire perimeters in California during 2017. The complete file can be accessed in the CA state geoportal
├── LICENSE
├── README.md
├── data
│   ├── California_Fire_Perimeters_2017
│   │   ├── California_Fire_Perimeters_2017.cpg
│   │   ├── California_Fire_Perimeters_2017.dbf
│   │   ├── California_Fire_Perimeters_2017.prj
│   │   ├── California_Fire_Perimeters_2017.shp
│   │   └── California_Fire_Perimeters_2017.shx
│   └── landsat8-2018-01-26-sb-simplified.nc
└── thomas-fire-analysis.ipynb
US EPA Daily AQI Data [Data File]. Accessed Oct 25, 2023
Landsat 8 satellite surface reflectance data, from MPC Landsat collection [Data File]. Accessed Nov 28, 2023
2017 CA fire perimeter shapefile [Data File]. Accessed November 28, 2023