-
Notifications
You must be signed in to change notification settings - Fork 31
Quick Start Guide (Deprecated)
This tutorial aims to give you a brief overview of what DataSpread provides, spanning basic operations and formula specification to more complex relational operations. After completing this tutorial, you should have a basic idea of DataSpread's key features. For more details, please refer to our User Guide. Not all steps in this guide may be supported in the latest release.
- Start
- Register Account and Manage Books
- Copy Data and Create Table
- Formula and Query Table
- Load Table and Use Relational Operators
Step 1: When you open the application (if you installed DataSpread locally) or our web-hosted site in the browser, you will be logged in as a guest user, with a new book open within our application.
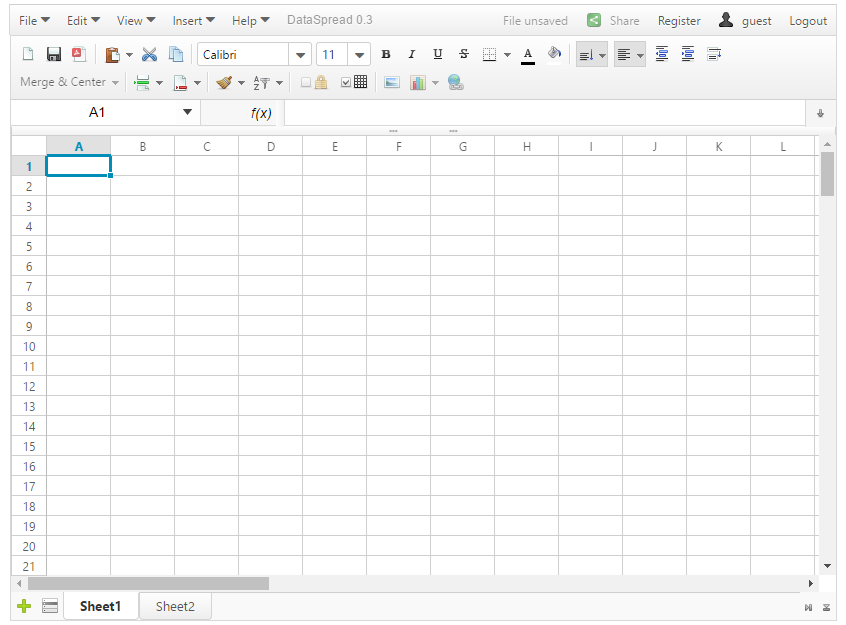
Step 2: Click on the "Register" button on the top-right corner, and register with your unique username and password.
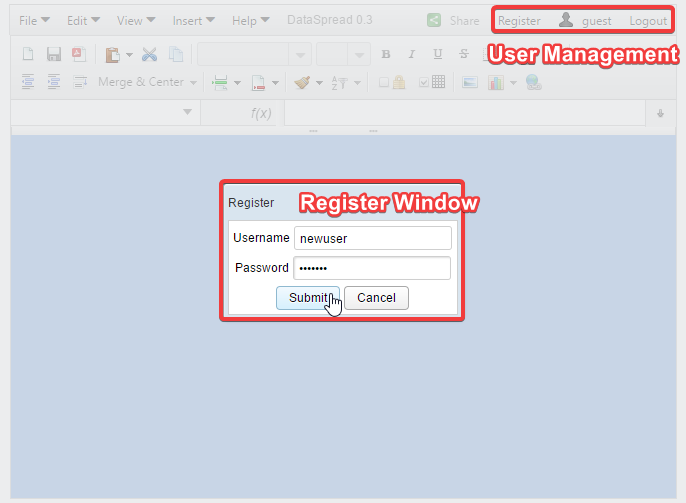
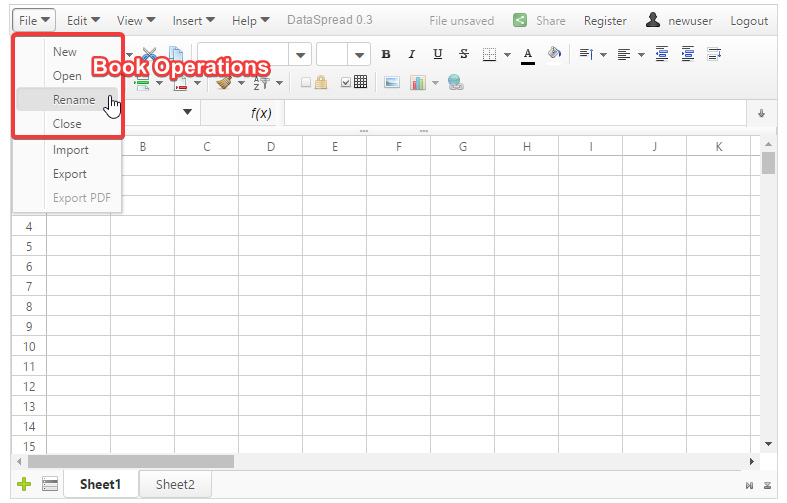
Step 3: Then, click on the "submit" button. You will be automatically logged in, with a new book open within our application. Next, go to the "File" menu on the top-left corner and select the "rename" option.
Step 4: Add a name for this book such as "tutorial" and click on the "save" button.

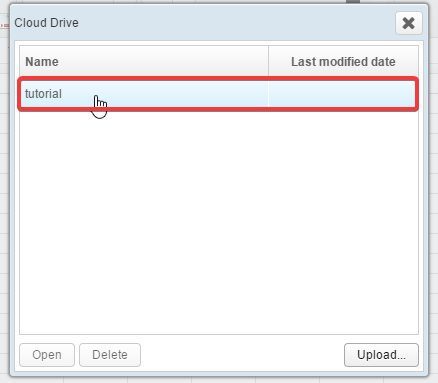
Step 5: Return to the "File" menu once again and select the "open" option. A pop-up window should appear, with "tutorial" in the book list.
Step 6: Now, let's try out some sheet operations. Click on the green "+" button on the bottom-left corner which will create a new sheet.
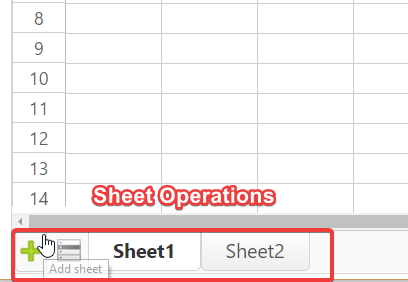
Step 7: Double click on "sheet3", which will allow you to rename the sheet. Rename the sheet to "My Sheet" and press enter to confirm.
Step 8: Now, let's create some data on the sheet. Copy the contents of the table below.
| employee | dept | supervisor | salary |
|---|---|---|---|
| Jesse | IT | Paul | 80000 |
| Mike | Sales | Naomi | 100000 |
| Rhonda | Engr | Mel | 120000 |
| Lee | Engr | Mel | 130000 |
Step 9: Select the cell A1 and use your paste shortcut to paste the data. The above table should be automatically filled into the sheet with a range of A1:D5.

Step 10: Next, select the region A1:C5 (i.e., don't include the salary column) and right click on the selected area. On the popup menu, move your cursor to "table" and select the "create" option.
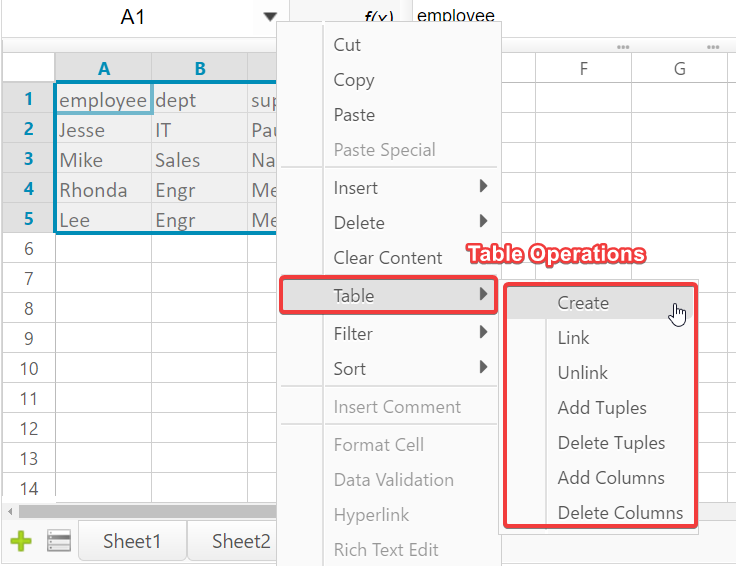
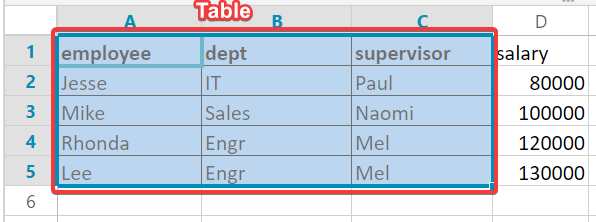
Step 11: In the popup window, write down your desired table name, such as "employlist", and click on "create". A message with "Table EMPLOYLIST is Successfully Created" will be shown and the formatting of the associated region should be changed as shown below.
Step 12: Please copy the table below to the sheet into range G1:J4; we will use this table in the last section of this guide.
| employee | dept | supervisor | salary |
|---|---|---|---|
| Jay | IT | Paul | 100000 |
| Rhonda | Engr | Mel | 120000 |
| Lee | Engr | Mel | 140000 |
You final sheet should look like the one shown below:

This section will teach you how to use formulae and execute SQL queries within DataSpread.
Step 13: Click on cell E1 and type in "Avg(Salary)". Click on cell E2 and enter the formula shown below:
=AVERAGE(D2:D5)
Press enter. DataSpread will evaluate this formula, with the value "107500" displayed in cell E2.
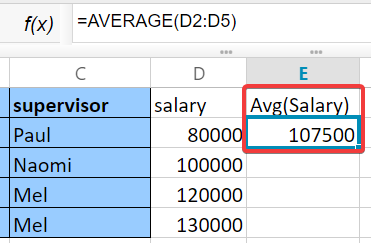
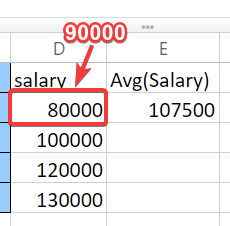
Step 14: Click on cell D2 and change the value from 80000 to 90000, and you should see the formula value of cell E2 changed to 110000.
Step 15: Now let's see how to employ SQL queries within DataSpread. Click on cell A7 and enter the query shown below:
=SQL("SELECT employee,dept FROM employlist WHERE dept = 'Engr'")
Step 16: This query will return two rows corresponding to Rhonda and Lee. Enter the formulae accordingly from the table below.
| A | B | |
|---|---|---|
| ... | ... | ... |
| 8 | =INDEX(A7,0,1) |
=INDEX(A7,0,2) |
| 9 | =INDEX(A7,1,1) |
=INDEX(A7,1,2) |
| 10 | =INDEX(A7,2,1) |
=INDEX(A7,2,2) |
Hints: For the further use of multiple index functions, you can type in the first INDEX formula and drag from the bottom right to auto-fill all the cells in the region with the corresponding parameters. Notice that you need to specify the index region with the $ sign to make the reference cell fixed across all the functions. The formula for the first cell should be =INDEX($A$7,0,1). For detailed usage of the INDEX function, please refer to Formulae Using Tables.

You should get the same results as the ones shown below:

This last section will describe how to load the table you've already created, as well as how to use relational operators. We will use the previous two tables above as examples. The original table (indexed at A1) represents our past employee list, while the modified table (indexed at G1) displays our current employee list.
Step 17: Suppose we found an error in the table employlist: the value Jesse should be Jessie instead. Now, we need to update the employlist table. Double click on the cell A2 and change the value Jesse to Jessie.

Step 18: Let's check if the update has percolated through the database. To check this, we want to load this table to the sheet to see if the changes are visible. Select the range I8:J10 and right click on the selected range. Move the cursor to the table menu, and click on the link option.
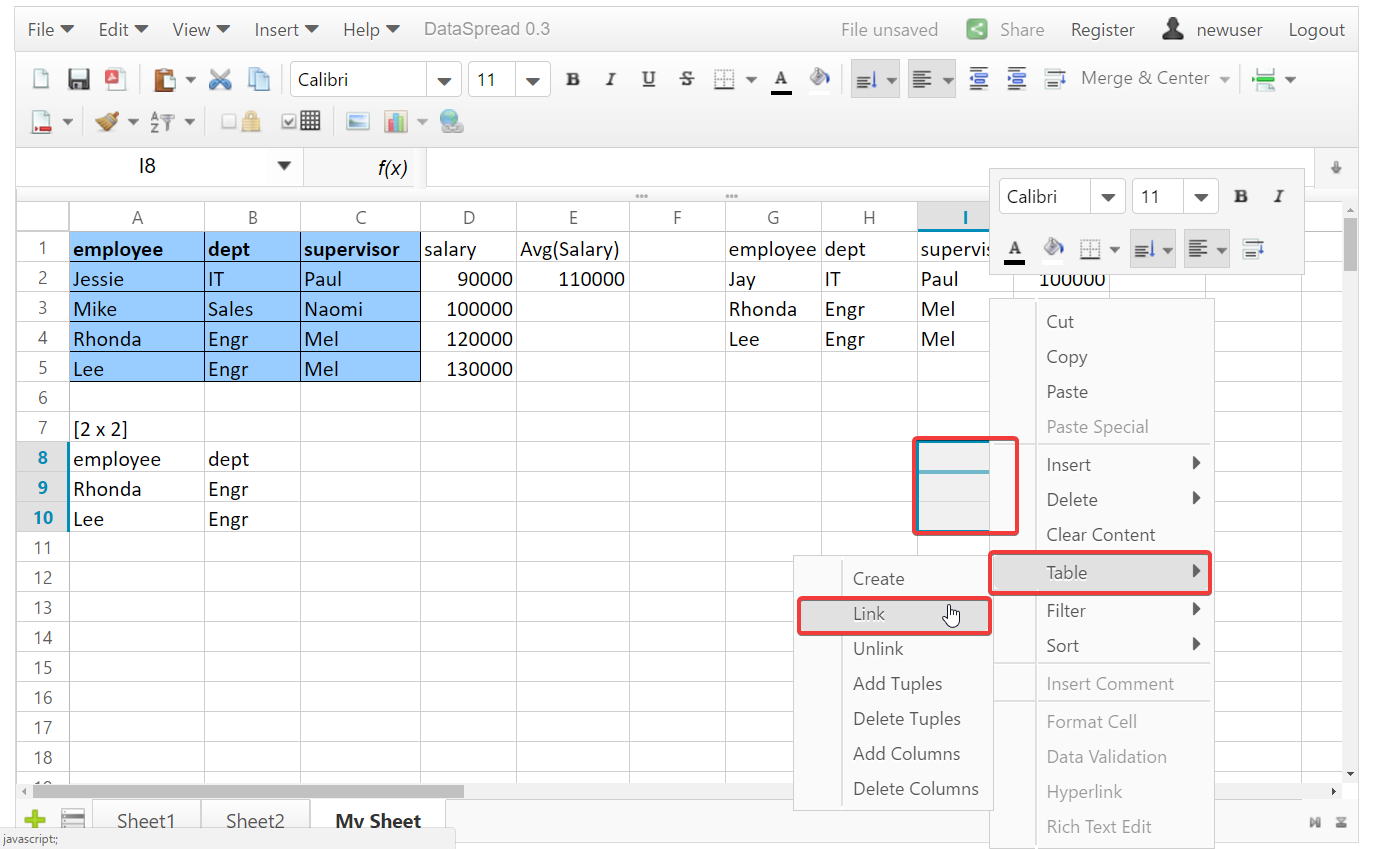
Step 19: Select our table "employlist" and click on "OK". Our table with a range of [3 x 2] is shown in the selected region and Jesse is corrected to Jessie, as desired. Notice here that we only load a small portion of the table, and the size of the actual table is [5 x 3].

Step 20: What if we want to see all of the newly hired employees? We can accomplish this task by using the DIFFERENCE operator. Click on cell D7 and enter operator as shown below:
=DIFFERENCE(G1:J4, A1:D5)
Step 21: The value returned in cell D7 is [2 x 4] which indicates that the result is a table with 2 rows and 4 columns. Next, type in the Index formula according to the table shown below. Or, if you'd like, as in Step 16, we can fill in INDEX($D$7,0,1) corresponding to the first cell and then drag across to populate the rest of the cells.
| ... | D | E | F | G | |
|---|---|---|---|---|---|
| ... | ... | ... | ... | ... | ... |
| 8 | ... | =INDEX(D7,0,1) |
=INDEX(D7,0,2) |
=INDEX(D7,0,3) |
=INDEX(D7,0,4) |
| 9 | ... | =INDEX(D7,1,1) |
=INDEX(D7,1,2) |
=INDEX(D7,1,3) |
=INDEX(D7,1,4) |
| 10 | ... | =INDEX(D7,2,1) |
=INDEX(D7,2,2) |
=INDEX(D7,2,3) |
=INDEX(D7,2,4) |
The result shows the set difference of these two regions, which is, precisely the newly hired employees, as displayed below:

Step 22: Now, say we want to see all of the hired employees, including both previous and current ones. To achieve this task, we can use the UNION operator. Place the formula below into cell A11:
=UNION(A1:D5, D7)
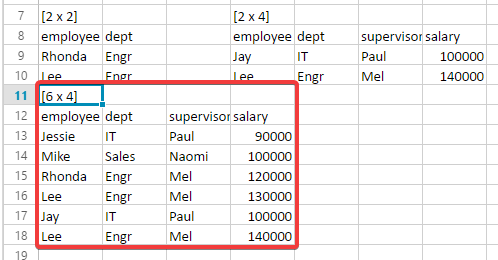
Step 23: On pressing enter, you will see a table value with [6 x 4] displayed in cell A11. If you want to check the result of the UNION, type in the INDEX formula into cells (or type and drag, as in Step 16), according to the table shown below:
| A | B | C | D | |
|---|---|---|---|---|
| ... | ... | ... | ... | ... |
| 12 | =INDEX(A11,0,1) |
=INDEX(A11,0,2) |
=INDEX(A11,0,3) |
=INDEX(A11,0,4) |
| 13 | =INDEX(A11,1,1) |
=INDEX(A11,1,2) |
=INDEX(A11,1,3) |
=INDEX(A11,1,4) |
| 14 | =INDEX(A11,2,1) |
=INDEX(A11,2,2) |
=INDEX(A11,2,3) |
=INDEX(A11,2,4) |
| 15 | =INDEX(A11,3,1) |
=INDEX(A11,3,2) |
=INDEX(A11,3,3) |
=INDEX(A11,3,4) |
| 16 | =INDEX(A11,4,1) |
=INDEX(A11,4,2) |
=INDEX(A11,4,3) |
=INDEX(A11,4,4) |
| 17 | =INDEX(A11,5,1) |
=INDEX(A11,5,2) |
=INDEX(A11,5,3) |
=INDEX(A11,5,4) |
| 18 | =INDEX(A11,6,1) |
=INDEX(A11,6,2) |
=INDEX(A11,6,3) |
=INDEX(A11,6,4) |
Your result should be the same as the one displayed below:
Step 24: Suppose each department has a bonus for this year. Copy the following bonus table into region F12:G15:
| dept | bonus |
|---|---|
| IT | 10000 |
| Sales | 5000 |
| Engr | 15000 |
Step 25: Next, we'd like to add the bonus to each employee according to the department. We can use the natural Join operator. The Join operator will take the first row of each region as it's attributes. In this case, since both table have dept attribute, the join will be performed base on dept. Place the formula below into cell A20:
=JOIN(A11,F12:G15)
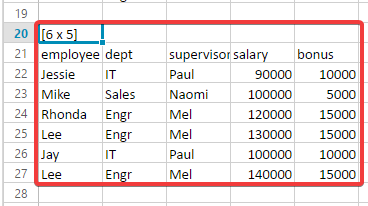
Step 26: On pressing enter, You will see a table value with [6 x 5] in cell A20. You can check the result according to the table below:
| A | B | C | D | E | |
|---|---|---|---|---|---|
| ... | ... | ... | ... | ... | ... |
| 12 | =INDEX(A20,0,1) |
=INDEX(A20,0,2) |
=INDEX(A20,0,3) |
=INDEX(A20,0,4) |
=INDEX(A20,0,5) |
| 13 | =INDEX(A20,1,1) |
=INDEX(A20,1,2) |
=INDEX(A20,1,3) |
=INDEX(A20,1,4) |
=INDEX(A20,1,5) |
| 14 | =INDEX(A20,2,1) |
=INDEX(A20,2,2) |
=INDEX(A20,2,3) |
=INDEX(A20,2,4) |
=INDEX(A20,2,5) |
| 15 | =INDEX(A20,3,1) |
=INDEX(A20,3,2) |
=INDEX(A20,3,3) |
=INDEX(A20,3,4) |
=INDEX(A20,3,5) |
| 16 | =INDEX(A20,4,1) |
=INDEX(A20,4,2) |
=INDEX(A20,4,3) |
=INDEX(A20,4,4) |
=INDEX(A20,4,5) |
| 17 | =INDEX(A20,5,1) |
=INDEX(A20,5,2) |
=INDEX(A20,5,3) |
=INDEX(A20,5,4) |
=INDEX(A20,5,5) |
| 18 | =INDEX(A20,6,1) |
=INDEX(A20,6,2) |
=INDEX(A20,6,3) |
=INDEX(A20,6,4) |
=INDEX(A20,6,5) |
Your result should be the same as below:
Step 27: Now we want to select all the employees whose income this year is lower than 110000. To do so, we can use the SELECT operator. Place the formula below into cell G20:
=SELECT(A20,ATTR_salary+ATTR_bonus<110000)
Step 28: On pressing enter, you will see a table value with [2 x 5] displayed in cell G20. If you want to check the result of the SELECT, type in the INDEX formula into cells, according to the table shown below:
| G | H | I | J | K | |
|---|---|---|---|---|---|
| ... | ... | ... | ... | ... | ... |
| 21 | =INDEX(G20,0,1) |
=INDEX(G20,0,2) |
=INDEX(G20,0,3) |
=INDEX(G20,0,4) |
=INDEX(G20,0,5) |
| 22 | =INDEX(G20,1,1) |
=INDEX(G20,1,2) |
=INDEX(G20,1,3) |
=INDEX(G20,1,4) |
=INDEX(G20,1,5) |
| 23 | =INDEX(G20,2,1) |
=INDEX(G20,2,2) |
=INDEX(G20,2,3) |
=INDEX(G20,2,4) |
=INDEX(G20,2,5) |
You should have the final sheet as below:

By completing this tutorial, you are exposed to the various functionalities provided by DataSpread. You can follow our User Guide and explore these functionalities in more detail.