-
Notifications
You must be signed in to change notification settings - Fork 1
How to determine the best value of Assessment of Response for Waterfall plot
Calculation of bars height for default Y-axis option "Best change"
When "Best change" option is selected in Y-axis control, bars height shows the best value (lowest) for '% change in the sum of target lesion diameters'.
Steps to calculate 'Best % change in the sum of target lesion diameters' (each step should be executed for each dosed subject):
- Determine baseline assessment. Baseline is the target lesion's date of scan [RTL_LESION_DATE] as close to but prior to the first drug dose date OR, if such does not exist, the first target lesion's date of scan after first dose date.
- Calculate the sum of the target lesion diameters [RTL_LESION_DIAMETER] at baseline.
- Determine each post-baseline assessments (all different target lesion dates of scan greater than baseline date).
- Calculate the sum of the target lesion diameters at each post-baseline assessment.
- Calculate % change from baseline in the sum of target lesion diameters at each post-baseline assessment.
- Determine the lowest % change from baseline in the sum of target lesion diameters at each post-baseline assessment.
Calculation of bar's height for Y-axis option “Week [X]”
Y-axis control provides “Week [X]” options along with the “Best change”. These options are data driven and provided only if there is at least one assessment in particular assessment week. When “Week [X]” option is selected in Y-axis control, bars height shows '% change in the sum of target lesion diameters' of the closest to ‘ideal day’ assessment. Steps to determine “Week [X]” and connected '% change in the sum of target lesion diameters' (each step should be executed for each dosed subject):
- At first, assessment frequency should be determined – it’s a part of dataset configuration and mapped in Admin UI within “Recist assessment summarised (recist2)” mapping. Usually assessment frequency is 6 or 8 weeks. If assessment frequency is empty for the whole dataset, default assessment frequency = 6 is used. If assessment frequency is missing for the particular assessments\subjects in the dataset, missed assessments will be assigned the same frequency that other events\subjects have in the dataset.
- When assessment frequency is known, probable assessment weeks are also known – week 6, 12, 18 or week 8, 16, 24 for example.
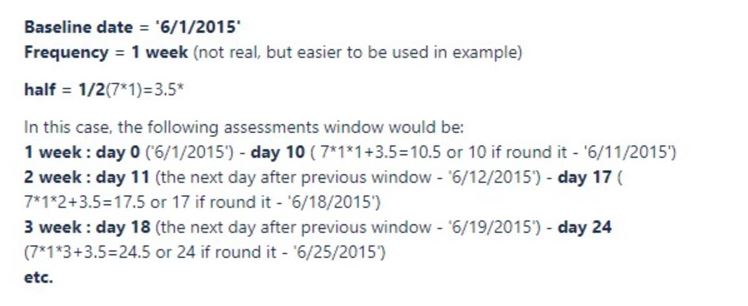
- ‘Ideal days’ for each week should be calculated as: (7Week X) – day 42 for assessment week 6 for example4) Next, date bins should be calculated The first bin is defined as the day of first dose for the subject until the midpoint between the first assessment week and the second assessment week. So, the first bin is day 0 to day calculated as: (7Week Xassessment frequency + half of the bin) Following bins are defined by dividing the relevant time-range at each midpoint date between week numbers and can be calculated as: (the next day after previous window) to (7Week X*assessment frequency + half of the bin)
Example:
- When bin dates are defined, target lesion dates of scan [RTL_LESION_DATE] should be placed into the bins.
- The nearest assessment with not-null sum of diameters in each bin to the ‘ideal day’ should be chosen as the RECIST assessment for the assessment week. If two of the assessments are equally distant from the 'ideal day', the assessment with the greater date will be used for plotting.
- Next, calculate the sum of the target lesion diameters at the RECIST assessment for each assessment week.
- Calculate % change from baseline in the sum of target lesion diameters at the RECIST assessment for each assessment week.
Colouring
'Colour by' control contains the following eight options:
- Study ID
- Study part
- Study drugs
- Assessment of Response (selected by default)
- Reason for withdrawal
- Primary tumour location Lesion value missing?
- Other cohort
"Assessment of Response"
"Assessment of Response" option has eight additional options:
- "Complete Response" (CR) – Purple
- "No Evidence of Disease" (NED) – Purple
- "Partial Response" (PR) – Blue
- "Progressive Disease" (PD) – Red
- "Stable Disease" (SD) – Grey
- "Not Evaluable" (NE) – Black
- "No assessment" (there is no such response in source files, but used in ACUITY4) - Black
- "Missing target" lesions (there is no such response in source files, but used in ACUITY4) – Yellow
Note 1: This does not need to be taken from the same assessment timepoint as the best % change in the sum of TLDs - they are the "best" values independent of the other.
Note 2: If both "Complete Response" and "No Evidence of Disease" are present on the plot, the responses are combined into one category in the legend. And "Not Evaluable" and "No assessment" are also combined into one category in the legend if they both are on the plot.
How to determine the best value of "Assessment of Response":
- Determine baseline assessment. Baseline is the target lesion date of scan [ RTL_LESION_DATE ] as close to but prior to first drug dose date OR if this does not exist, then the first target lesion date of scan post-first dose date.
- Determine the lesion numbers of target lesions at baseline.
- Determine each post-baseline assessments (all different target lesion dates of scan greater than baseline date).
- Determine the lesion numbers of target lesions at each post-baseline assessments.
- Determine assessment of response at each post-baseline assessment. Note: Join RESULT_RECIST_TARGET_LESION and RESULT_RECIST_ASSESSMENT tables by (RTL_PAT_ID= RCA_PAT_ID and RTL_VISIT_DATE= RCA_VISIT_DATE and RTL_VISIT_NUMBER= RCA_VISIT).
- Calculate the best assessment of response using the following rules:
- For a subject where the only "Assessment of Response" available is “Not Evaluable”, the best assessment of response is ”Not Evaluable”.
- For a subject where there is no recist2 data to link to the recist1 data, the best assessment of response is “No assessment”
- Note: “Missing target lesions” means that some of the target lesions present at baseline are not assessed at any post-baseline assessment (target lesion with [RTL_LESION_NUMBER] are not in the RECIST1 file/ RESULT_RECIST_TARGET_LESION db table for an assessment or are in, but with null diameter).
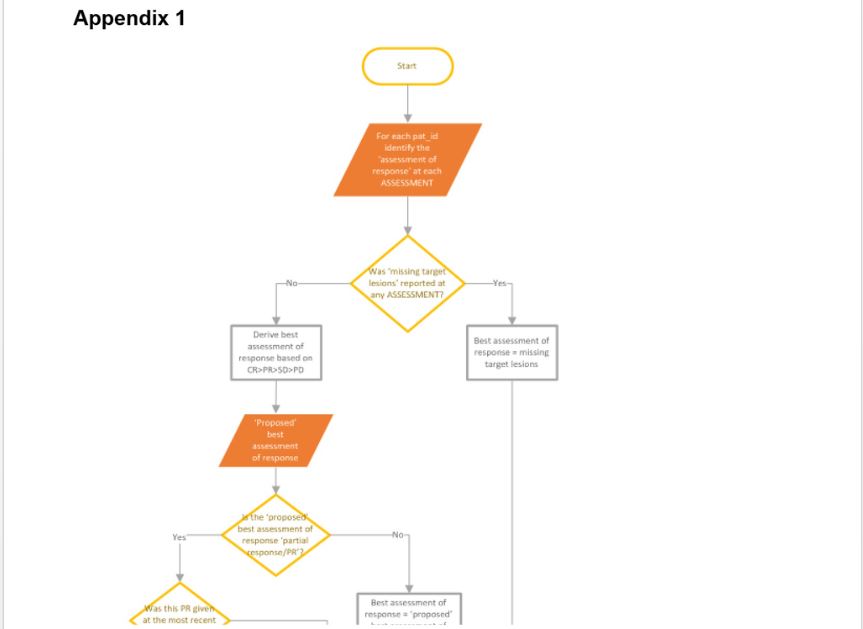
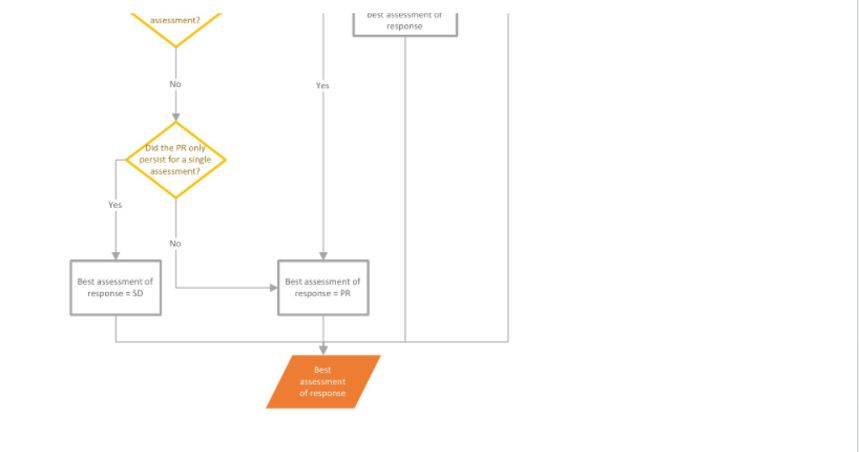
- For other cases, the logic is described in the workflow diagram present in .
- System Requirements
- Azure Setup
- Machine Insights and CBioPortal Integration
- SSL Certificates
- Applications Setup
- Application Spring Configs
- Profiles
- Migrating to ACUITY 9
- Github packages and Docker images
- Result data tables
- Mapping data tables
- Third party solution tables
- Other data tables
- Tables to delete


