I was invited to present this project at Ironhack Hackshow on March 9th, 2020. The presentation that I made on that day is available on this link. It was awarded best Data Analytics project of the cohort. It was the opportunity for me to learn how to deal with image data, and build my first CNN using Tensorflow.
Invasive Ductal Carcinoma (IDC) is the most common form of breast cancer. Accurately identifying and categorizing breast cancer subtypes is an important clinical task, and automated methods can be used to save time and reduce error.
The original dataset can be downloaded from this Kaggle page. My work is largely inspired from Allunia's kernel.
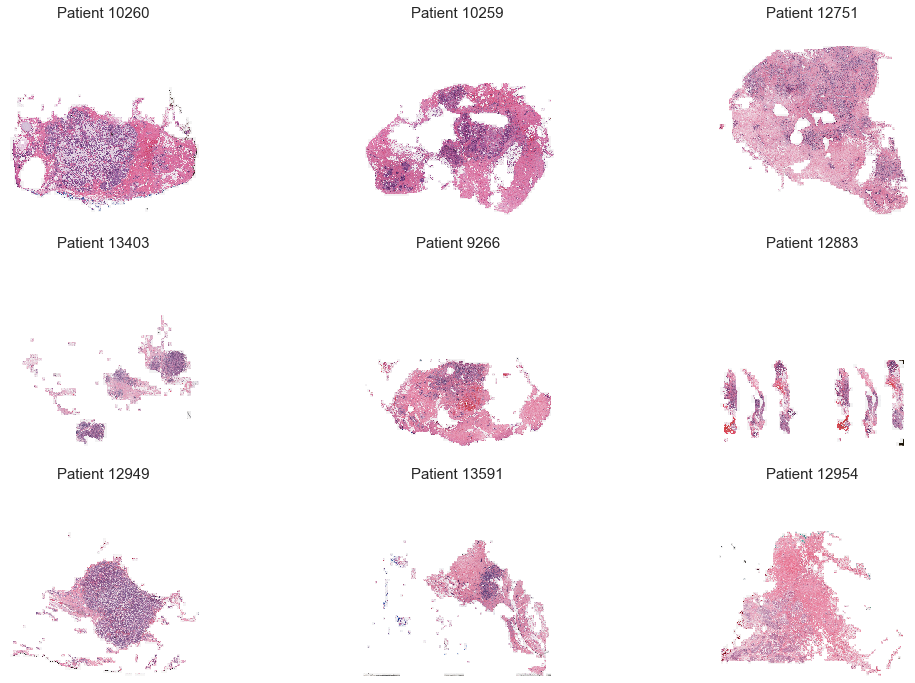
The dataset is composed of a 279 patients, for which I had a set of histological images (50x50 pixels each), that were either labeled as benign or malignant. Each image was associated to an x and y coordinate, meaning that they could be plotted together to reconstitute a slide of patient's breast tissue.
Visualization of patient tissues (each patient image is a combination of patches):
A large part of the work was to make the proper visualizations to get a good understanding of the dataset. To do do, I had to work deeply with images (combining patches to recreate patient tissues, highlighting malignant areas, etc.).
- The dataset is highly imbalanced, on 3 indicators: the volume of patches available per patient, the proportion of malignant patches per patient (indicating different severity levels of the disease), and the overall proportion of total patches being benign (78%) or malignant (22%). It means that while building our train, validation and test sets, we should make sure to have a good representation of 1. patient severity levels and 2. malignant patches volumes.
- Color seems to be a decisive information to spot cancerous patches: they tend to be darker, and more purple than benign ones. But as some benign patches also appear to be dark, color does not seem to be the only feature to consider in image classification. Still, to build the model, it makes sense to keep images in a RGB format (vs. grayscale that would loose significant info).
- Malignant patches are often grouped into localized tumors.
The goal of our model is to classify patches between benign and malignant.
- The first risk that we can encounter is that the model classifies a patch as non-cancerous, while it actually is: this is the most dangerous error that our model could make, as it would mean that the patient would go back home without any appropriate treatment. For this reason, our primary KPI will be Recall (objective: minimize False Negatives).
- The second risk that we can encounter is that the model classifies a patch as cancerous, while it is not. In this case, the risk is limited, as a doctor will still check the patient folder, and will be able to exclude the bias. However, we should save doctors time as much as we can: this is the reason why our secondary KPI will be the F1-Score (objective: strike a balance between False Positives and False Negatives).
During a previous phase of this project, several Machine Learning approaches were tested on a 10% sample of the dataset:
- Between all Machine Learning models, CatBoostClassifier is by far the best performing one.
- The model performs better on RGB images than grayscale ones.
- The use of dimensionality reduction techniques (PCA) did not improve model performance.
- Combining image coordinates with predicted probabilities does not help the model (tendency to over-predict).
- We did not notice a significant performance increase while doing affine transformations on images (flip, rotate, shear, etc.)
All these cul-de-sac let us think that we might have reached the limits of traditional Machine Learning models for image classification tasks. As a final step, we decided to re-train the "classic" CatBoostClassifier of the whole database, so that we can compare its overall performance with Convolutional Neural Networks.
- Deep learning: create a Convolutional Neural Network (CNN) using Tensorflow Keras
- 2 convolutional layers of respectivly 32 and 64 filters
- 1 flatten layer
- 1 fully-connected artificial NN of 128 neurons
- Categorical Crossentropy loss, Adadelta optimizer
- Machine Learning: compare the performance of our CNN with the CatBoostClassifier model
- Deep learning: Recall 80.2% (+7.9% vs. ML) , F1-Score 77.1% (+1.9% vs. ML)
- Machine Learning: Recall 72.3%, F1-Score 75.2%
Tensorflow, Keras, Sickit-Learn, CatBoost, Skimage, Numpy

