In the following, we show an example of running MONAI-bundle configurations with NVFlare using the FL simulator.
For an example with real-world deployment settings, see here.
To execute the below commands, please open a terminal and go to the folder containing this tutorial.
Follow the setup to create a virtual environment with the MONAI-NVFlare integration installed to use in JupyterLab.
Install the required packages in your virtual environment:
pip install -r ./requirements.txt
Download the MONAI bundle as ./${JOB_NAME}/app/config/spleen_ct_segmentation.
JOB_NAME=job
python3 -m monai.bundle download --name "spleen_ct_segmentation" --version "0.5.4" --bundle_dir ./${JOB_NAME}/app/config
In this example, JOB_NAME can be either job, job_multi_gpu or job_stats, depending on the configuration you would like to run (see below).
The final folder structure under JOB_NAME will be:
.
├── app
│   └── config
│       ├── config_fed_client.json
│       ├── config_fed_server.json
│       └── spleen_ct_segmentation
│           ├── LICENSE
│           ├── configs
│           │   ├── evaluate.json
│           │   ├── inference.json
│           │   ├── logging.conf
│           │   ├── metadata.json
│           │   ├── multi_gpu_evaluate.json
│           │   ├── multi_gpu_train.json
│           │   └── train.json
│           ├── docs
│           │   ├── README.md
│           │   └── data_license.txt
│           └── models
│               ├── model.pt
│               └── model.ts
└── meta.json
Download the spleen CT data from the MSD challenge and update data path.
Note: The dataset will be saved under
./data.
JOB_NAME=job
python3 download_spleen_dataset.py
sed -i "s|/workspace/data/Task09_Spleen|${PWD}/data/Task09_Spleen|g" ${JOB_NAME}/app/config/spleen_ct_segmentation/configs/train.json
Note: Full FL training could take several hours for this task. To speed up your experimentation, you can reduce the
num_roundsvalue inconfig_fed_server.json, e.g. to 5 rounds.
In resource restricted environments where you need to simulate several clients (-n 2 in this case) on the same GPU device, you can run the simulator using:
nvflare simulator job --workspace /tmp/nvflare/sim_spleen_ct_seg --threads 1 --n_clients 2
If you have several gpus in your system, you can assign one for each client and use two threads.
We can also specify the client names via the --clients argument
and assign them to the appropriate GPU device using the --gpu argument.
nvflare simulator job --workspace /tmp/nvflare/sim_spleen_ct_seg --clients site-1,site-2 --gpu 0,1
If you have several gpus in your system and want to simulate multi-gpu training on one client,
please follow step 2 & 3 above but replace JOB_NAME=job with JOB_NAME=job_multi_gpu. This will use NVFlare's PTMultiProcessExecutor
to start multi-gpu training using torchrun on one client.
nvflare simulator job_multi_gpu --workspace /tmp/nvflare/sim_spleen_ct_seg --threads 1 --n_clients 1
To monitor the training job, you can start tensorboard:
tensorboard --logdir /tmp/nvflare/sim_spleen_ct_seg
With the default setting and running on multiple gpus (section 4.2), the expected TensorBoard training curves look like this when training from scratch:
In order to load a pretrained model provided in the MONAI bundle, define the source_ckpt_filename argument of MonaiBundlePersistor in "config_fed_server.json", e.g.:
    {
      "id": "persistor",
      "path": "monai_nvflare.monai_bundle_persistor.MonaiBundlePersistor",
      "args": {
        "bundle_root": "config/spleen_ct_segmentation",
        "source_ckpt_filename": "models/model.pt"
      }
    }
NOTE: For more information about the simulator, see here.
To compute summary statistics on the datasets defined in the MONAI bundle, we can use NVFlare's StatisticsController.
Again, please step 2 & 3 above but replace JOB_NAME=job with JOB_NAME=job_stats.
To avoid caching the data for training (which will not be executed during the statistics workflow), set cache_rate=0 in train.json.
nvflare simulator job_stats --workspace /tmp/nvflare/sim_spleen_ct_seg --n_clients 2 --gpu 0,1
The histogram results will be placed in the workspace directory under simulate_job/statistics/image_statistics.json.
Additional summary statistics, like average image shapes and spacings, computed by MONAI are placed under simulate_job/app_server/.
See stats_demo/simulate_job/app_server for examples.
For an end-to-end demo, including visualization of the gathered statistics, open the stats_demo.ipynb notebook in stats_demo.
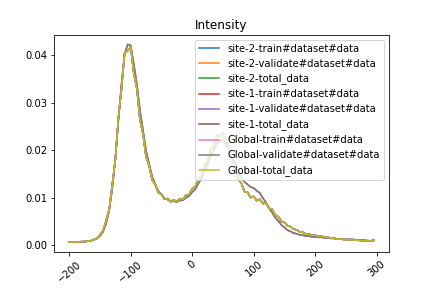
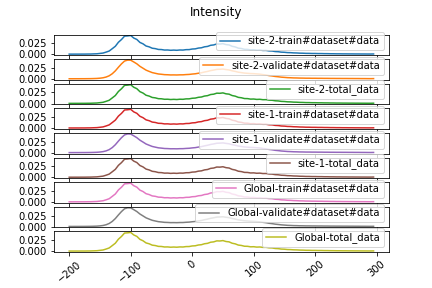
The demo notebook shows how to visualize the site and aggregated global image intensity histograms.
Either as overlay:
Or side by side:


