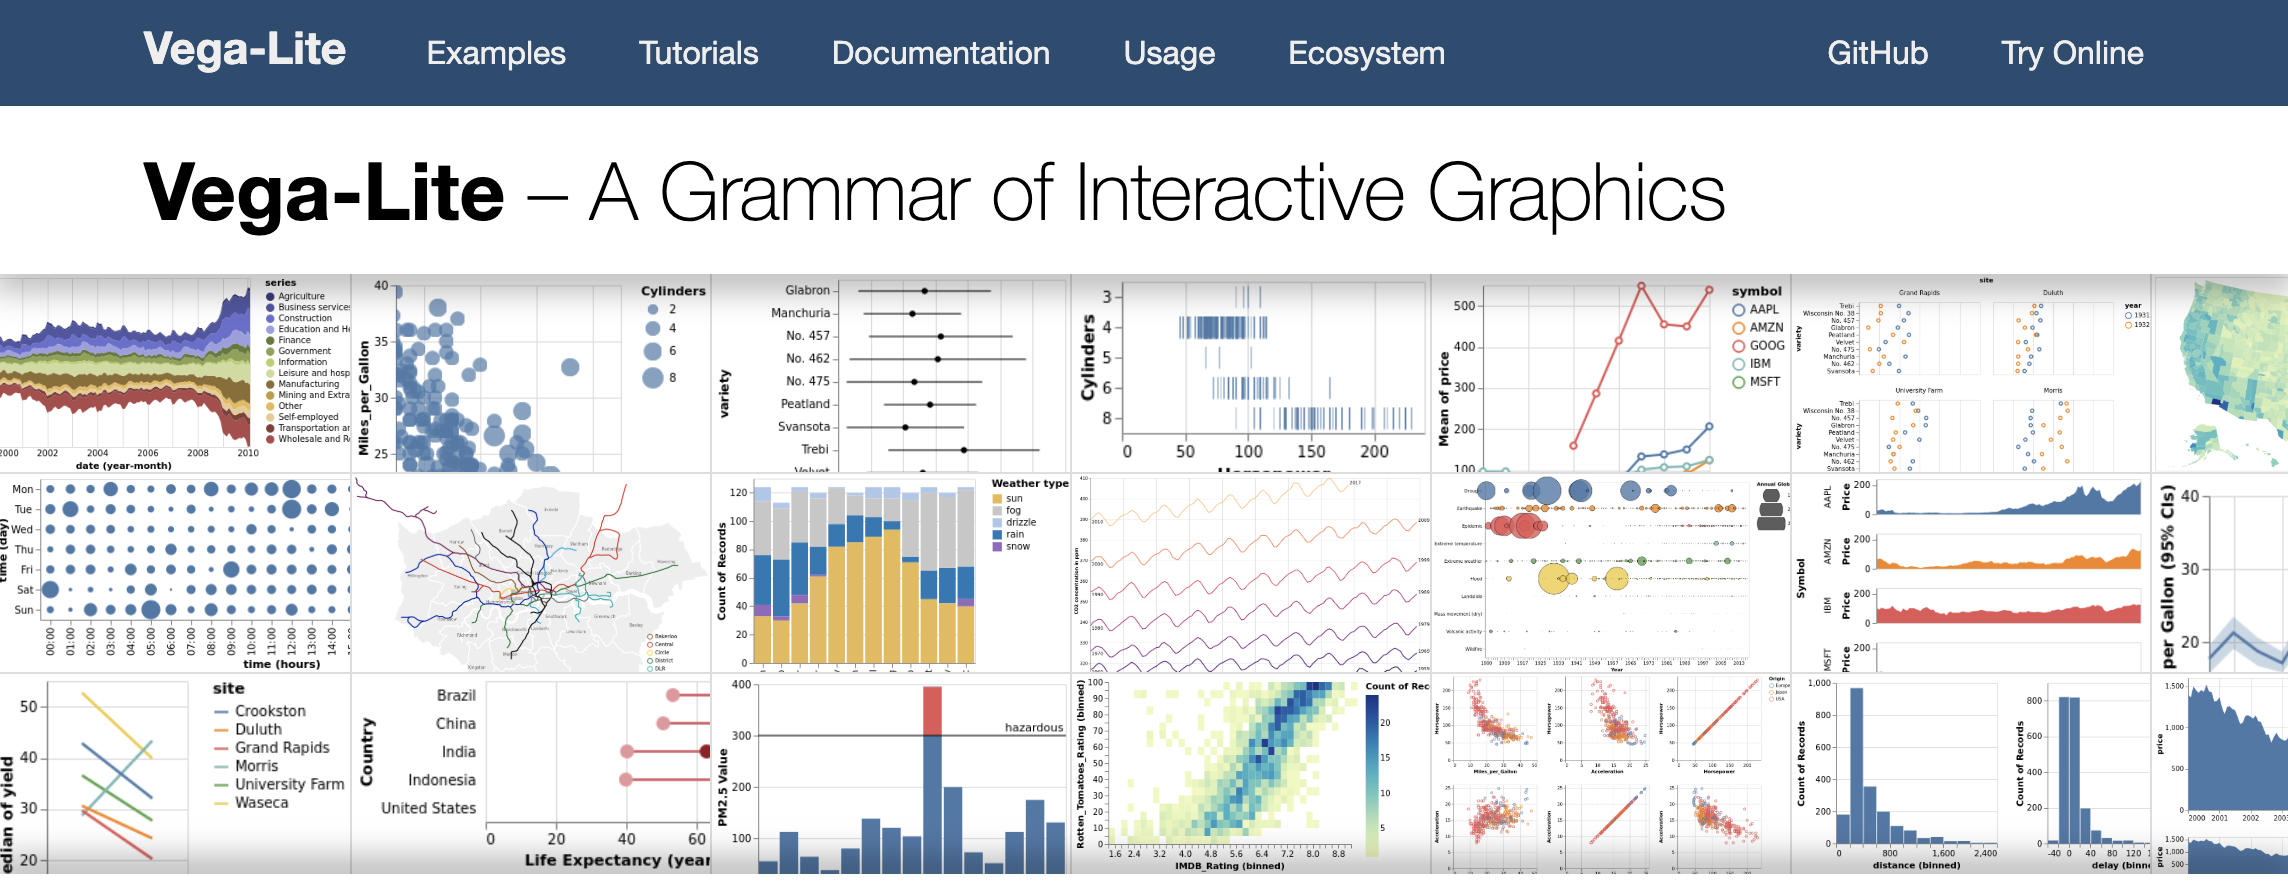
Docsify is a powerful and easy-to-use documentation site generator. You can quickly publish your documentation on github, ...
Some strange guys want to display diagrams inside documentation. Vega/vegalite can be a pleasant way to draw its.
This documentation explains how to integrate vega/vegalite diagrams into your docsify documentation.
Add blocks of code in your markdown with vega or vegalite syntax property.
```vega
your vega code
```

```vegalite
your vegalite code
```
You can write either json or url to external code :
```vega
{
  "$schema": "https://vega.github.io/schema/vega-lite/v5.json",
  "width": "800",
  "height": "600",
  "data": {
   ...
  }
}
```

```vega
https://raw.githubusercontent.com/vega/vega/master/docs/examples/bar-chart.vg.json
```In your docsify index.html your must add following code :
  window.$docsify = {
  ...
  }

  // import vega
  // <script src="//cdn.jsdelivr.net/npm/vega@5"></script>
  // <script src="//cdn.jsdelivr.net/npm/vega-lite@5"></script>
  // <script src="//cdn.jsdelivr.net/npm/vega-embed@6"></script>
  // <script src="//cdn.jsdelivr.net/gh/jerCarre/[email protected]/lib/docsivega.js"></script>
According to official vega documentation you can add extra options for all diagrams :
  window.$docsify = {
    ...
      vegalite: {
        actions: {editor: true, source: true, compiled: false}
      }
    ...
  }

  // import vega
  // <script src="//cdn.jsdelivr.net/npm/vega@5"></script>
  // <script src="//cdn.jsdelivr.net/npm/vega-lite@5"></script>
  // <script src="//cdn.jsdelivr.net/npm/vega-embed@6"></script>
// <script src="//cdn.jsdelivr.net/gh/jerCarre/[email protected]/lib/docsivega.js"></script> ```vega
https://raw.githubusercontent.com/vega/vega/master/docs/examples/bar-chart.vg.json
```https://raw.githubusercontent.com/vega/vega/master/docs/examples/bar-chart.vg.json
```vega
{
  "$schema": "https://vega.github.io/schema/vega-lite/v5.json",
  "width": 500,
  "height": 300,
  "data": {
    "url": "https://vega.github.io/vega-lite/data/us-10m.json",
    "format": {
      "type": "topojson",
      "feature": "counties"
    }
  },
  "transform": [{
    "lookup": "id",
    "from": {
      "data": {
        "url": "https://vega.github.io/vega-lite/data/unemployment.tsv"
      },
      "key": "id",
      "fields": ["rate"]
    }
  }],
  "projection": {
    "type": "albersUsa"
  },
  "mark": "geoshape",
  "encoding": {
    "color": {
      "field": "rate",
      "type": "quantitative"
    }
  }
}
```
{
"$schema": "https://vega.github.io/schema/vega-lite/v5.json",
"width": 500,
"height": 300,
"data": {
"url": "https://vega.github.io/vega-lite/data/us-10m.json",
"format": {
"type": "topojson",
"feature": "counties"
}
},
"transform": [{
"lookup": "id",
"from": {
"data": {
"url": "https://vega.github.io/vega-lite/data/unemployment.tsv"
},
"key": "id",
"fields": ["rate"]
}
}],
"projection": {
"type": "albersUsa"
},
"mark": "geoshape",
"encoding": {
"color": {
"field": "rate",
"type": "quantitative"
}
}
}
Code from this vega example.
{
  "$schema": "https://vega.github.io/schema/vega/v5.json",
  "description": "An interactive globe depicting earthquake locations and magnitudes.",
  "padding": 10,
  "width": 500,
  "height": 500,
  "autosize": "none",

  "signals": [
    {
      "name": "quakeSize", "value": 6,
      "bind": {"input": "range", "min": 0, "max": 12}
    },
    {
      "name": "rotate0", "value": 90,
      "bind": {"input": "range", "min": -180, "max": 180}
    },
    {
      "name": "rotate1", "value": -5,
      "bind": {"input": "range", "min": -180, "max": 180}
    }
  ],

  "data": [
    {
      "name": "sphere",
      "values": [
        {"type": "Sphere"}
      ]
    },
    {
      "name": "world",
      "url": "https://vega.github.io/vega/data/world-110m.json",
      "format": {
        "type": "topojson",
        "feature": "countries"
      }
    },
    {
      "name": "earthquakes",
      "url": "https://vega.github.io/vega/data/earthquakes.json",
      "format": {
        "type": "json",
        "property": "features"
      }
    }
  ],

  "projections": [
    {
      "name": "projection",
      "scale": 225,
      "type": "orthographic",
      "translate": {"signal": "[width/2, height/2]"},
      "rotate": [{"signal": "rotate0"}, {"signal": "rotate1"}, 0]
    }
  ],

  "scales": [
    {
      "name": "size",
      "type": "sqrt",
      "domain": [0, 100],
      "range": [0, {"signal": "quakeSize"}]
    }
  ],

  "marks": [
    {
      "type": "shape",
      "from": {"data": "sphere"},
      "encode": {
        "update": {
          "fill": {"value": "aliceblue"},
          "stroke": {"value": "black"},
          "strokeWidth": {"value": 1.5}
        }
      },
      "transform": [
        {
          "type": "geoshape",
          "projection": "projection"
        }
      ]
    },
    {
      "type": "shape",
      "from": {"data": "world"},
      "encode": {
        "update": {
          "fill": {"value": "mintcream"},
          "stroke": {"value": "black"},
          "strokeWidth": {"value": 0.35}
        }
      },
      "transform": [
        {
          "type": "geoshape",
          "projection": "projection"
        }
      ]
    },
    {
      "type": "shape",
      "from": {"data": "earthquakes"},
      "encode": {
        "update": {
          "opacity": {"value": 0.25},
          "fill": {"value": "red"}
        }
      },
      "transform": [
        {
          "type": "geoshape",
          "projection": "projection",
          "pointRadius": {"expr": "scale('size', exp(datum.properties.mag))"}
        }
      ]
    }
  ]
}
{
  "$schema": "https://vega.github.io/schema/vega/v5.json",
  "description": "A radar chart example, showing multiple dimensions in a radial layout.",
  "width": 400,
  "height": 400,
  "padding": 40,
  "autosize": {"type": "none", "contains": "padding"},

  "signals": [
    {"name": "radius", "update": "width / 2"}
  ],

  "data": [
    {
      "name": "table",
      "url": "https://gist.githubusercontent.com/jerCarre/42fecbe4d09c78c894f3237230bde32f/raw/a2628a18671e7d9944da5a34195dd9a02d128347/radar_data.json"
    },
    {
      "name": "keys",
      "source": "table",
      "transform": [
        {
          "type": "aggregate",
          "groupby": ["key"]
        }
      ]
    }
  ],

  "scales": [
    {
      "name": "angular",
      "type": "point",
      "range": {"signal": "[-PI, PI]"},
      "padding": 0.5,
      "domain": {"data": "table", "field": "key"}
    },
    {
      "name": "radial",
      "type": "linear",
      "range": {"signal": "[0, radius]"},
      "zero": true,
      "nice": false,
      "domain": {"data": "table", "field": "value"},
      "domainMin": 0
    },
    {
      "name": "color",
      "type": "ordinal",
      "domain": {"data": "table", "field": "category"},
      "range": {"scheme": "category10"}
    }
  ],

  "encode": {
    "enter": {
      "x": {"signal": "radius"},
      "y": {"signal": "radius"}
    }
  },

  "marks": [
    {
      "type": "group",
      "name": "categories",
      "zindex": 1,
      "from": {
        "facet": {"data": "table", "name": "facet", "groupby": ["category"]}
      },
      "marks": [
        {
          "type": "line",
          "name": "category-line",
          "from": {"data": "facet"},
          "encode": {
            "enter": {
              "interpolate": {"value": "linear-closed"},
              "x": {"signal": "scale('radial', datum.value) * cos(scale('angular', datum.key))"},
              "y": {"signal": "scale('radial', datum.value) * sin(scale('angular', datum.key))"},
              "stroke": {"scale": "color", "field": "category"},
              "strokeWidth": {"value": 1},
              "fill": {"scale": "color", "field": "category"},
              "fillOpacity": {"value": 0.1}
            }
          }
        },
        {
          "type": "text",
          "name": "value-text",
          "from": {"data": "category-line"},
          "encode": {
            "enter": {
              "x": {"signal": "datum.x"},
              "y": {"signal": "datum.y"},
              "text": {"signal": "datum.datum.value"},
              "align": {"value": "center"},
              "baseline": {"value": "middle"},
              "fill": {"value": "black"}
            }
          }
        }
      ]
    },
    {
      "type": "rule",
      "name": "radial-grid",
      "from": {"data": "keys"},
      "zindex": 0,
      "encode": {
        "enter": {
          "x": {"value": 0},
          "y": {"value": 0},
          "x2": {"signal": "radius * cos(scale('angular', datum.key))"},
          "y2": {"signal": "radius * sin(scale('angular', datum.key))"},
          "stroke": {"value": "lightgray"},
          "strokeWidth": {"value": 1}
        }
      }
    },
    {
      "type": "text",
      "name": "key-label",
      "from": {"data": "keys"},
      "zindex": 1,
      "encode": {
        "enter": {
          "x": {"signal": "(radius + 5) * cos(scale('angular', datum.key))"},
          "y": {"signal": "(radius + 5) * sin(scale('angular', datum.key))"},
          "text": {"field": "key"},
          "align": [
            {
              "test": "abs(scale('angular', datum.key)) > PI / 2",
              "value": "right"
            },
            {
              "value": "left"
            }
          ],
          "baseline": [
            {
              "test": "scale('angular', datum.key) > 0",
              "value": "top"
            },
            {
              "test": "scale('angular', datum.key) == 0",
              "value": "middle"
            },
            {
              "value": "bottom"
            }
          ],
          "fill": {"value": "black"},
          "fontWeight": {"value": "bold"}
        }
      }
    },
    {
      "type": "line",
      "name": "outer-line",
      "from": {"data": "radial-grid"},
      "encode": {
        "enter": {
          "interpolate": {"value": "linear-closed"},
          "x": {"field": "x2"},
          "y": {"field": "y2"},
          "stroke": {"value": "lightgray"},
          "strokeWidth": {"value": 1}
        }
      }
    }
  ]
}
The Github gist is HERE
