Note: Julia v1.0 has recently been released, this package is unlikely to be fully compatible but will be updated in due course.
A Julia package for inferring the strength of selection from cancer sequencing data. Package simultaneously estimates the number of subclones in the population and their relative fitnesses. This is done by generating synthetic data by simulating different population dynamics (see CancerSeqSim.jl) and fitting this to data using Approximate Bayesian Computation (see ApproxBayes.jl).
To download the package, once you're in a Julia session type the following command:
Pkg.clone("https://github.com/marcjwilliams1/SubClonalSelection.jl")Then once you are in a julia session the package can be loaded with
using SubClonalSelectionRunning Pkg.test("SubClonalSelection") will run a test suite to confirm the algorithm works on some test data and recovers the ground truth from some synthetic data with known input parameters.
Below is an example of how to run an analysis, for some more examples with more details go here.
Running an analysis requires variant allele frequencies (VAFs) as measured in deep sequencing of cancer samples. Generating the synthetic data assumes that the cancer is diploid, therefore any mutations falling in non-diploid regions should be removed. This does unfortunately mean that in highly aneuploid tumours, there will not be enough mutations to perform an analysis. We would recommend a minimum of 100 mutations.
The main function to perform an analysis is fitABCmodels. This takes as its first argument either a vector of Floats or a string pointing to a text file with a vector of floats, which will be read in automatically. The second argument is the name of the sample you wish to analyse which will be used to write the data and plots to a file. There are then a number of keyword arguments set to reasonable defaults. More details of these arguments and their defaults can be found by typing ?fitABCmodels in a Julia session.
There is some example data generated from the simulation found in the examples directory. For example the following command will run the inference on the oneclone.txt data set with 400 posterior samples and 5*10^5 iterations given sequencing depth of sample is 300X:
srand(123)
out = fitABCmodels("example/oneclone.txt",
  "oneclone",
  read_depth = 300,
  resultsdirectory = "example",
  Nmaxinf = 10^6,
  maxiterations = 5*10^5,
  save = true,
  nparticles = 400);
Running this is quite computationally expensive, so running on a cluster would be recommended in most cases.
Also included are a number of functions to summarize the output and plot the posterior. The output of the fitABCmodels function prints a summary of the posterior distribution as well as some details on the ABC convergence. For example for the above we can see a print out of the model fitting results:
out

Total number of simulations: 5.31e+05
Cumulative number of simulations = [400, 1501, 3347, 6755, 11325, 17583, 25144, 43005, 94935, 225243, 531167]
Acceptance ratio: 7.53e-04
Tolerance schedule = [5701.38, 3576.56, 2353.92, 1721.4, 1348.54, 1156.23, 1021.12, 877.64, 721.45, 575.07, 467.33]
Model probabilities:
        Model 1 (0 subclones): 0.003
        Model 2 (1 subclones): 0.819
        Model 3 (2 subclones): 0.178
Parameters:
Model 1 (0 subclones)
        Median (95% intervals):
        Parameter 1 - μ/β: 21.81 (20.75,24.80)
        Parameter 2 - Clonal Mutations: 352.81 (345.11,382.23)
        Parameter 3 - Cellularity: 0.68 (0.66,0.69)
Model 2 (1 subclones)
        Median (95% intervals):
        Parameter 1 - μ/β: 17.81 (14.30,23.13)
        Parameter 2 - Clonal Mutations: 308.29 (232.27,362.17)
        Parameter 3 - Fitness: 0.86 (0.40,2.27)
        Parameter 4 - Time (tumour doublings): 8.15 (5.06,12.50)
        Parameter 5 - Cellularity: 0.70 (0.68,0.74)
        Parameter 6 - Subclone Frequency: 0.62 (0.51,0.70)
        Parameter 7 - Subclone Mutations: 222.00 (151.71,295.00)
Model 3 (2 subclones)
        Median (95% intervals):
        Parameter 1 - μ/β: 14.88 (11.83,18.84)
        Parameter 2 - Clonal Mutations: 304.75 (252.96,366.35)
        Parameter 3 - Fitness - Subclone 1: 1.38 (0.41,23.07)
        Parameter 4 - Time (tumour doublings) - Subclone 1: 9.88 (4.10,13.98)
        Parameter 5 - Fitness - Subclone 2: 0.84 (0.14,3.05)
        Parameter 6 - Time (tumour doublings) - Subclone 2: 8.71 (2.54,14.05)
        Parameter 7 - Cellularity: 0.70 (0.67,0.73)
        Parameter 8 - Subclone 1 Frequency: 0.63 (0.53,0.72)
        Parameter 9 - Subclone 2 Frequency: 0.09 (0.05,0.51)
        Parameter 10 - Subclone 1 Mutations: 216.00 (82.09,280.98)
        Parameter 11 - Subclone 2 Mutations: 192.00 (72.94,301.17)
We can also plot the posterior distributions.
Plot the posterior model probabilities.
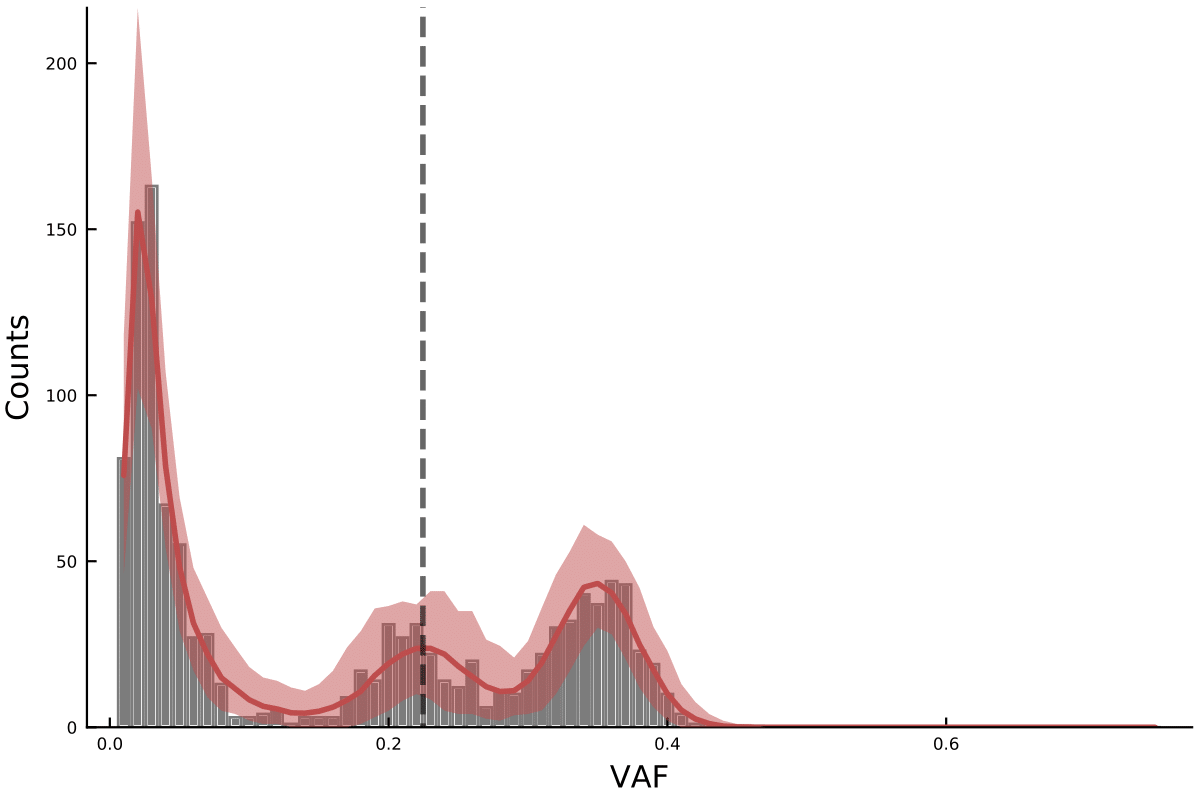
plotmodelposterior(out)Plot the histogram for model with 1 subclone (second argument is the number of subclones).
plothistogram(out, 1)Plot the posterior parameter distribution for model with 1 subclone.
plotparameterposterior(out, 1)Note the ground truth of the parameters in this case are. And as can be seen we do a reasonably good job of recovering the parameters. All ground truth parameters are within the 95% credible intervals.
- Mutation rate: 20.0
- Number of clonal mutations: 300
- Number of subclones: 1
- Cellularity: 0.7
- Tumour population size: 10^6
- Subclone frequency: 0.58
- Fitness advantage: 1.03
- Mutations in subclone: 251
- Time emerges (tumour doublings): 9.0
- Read depth: 300X
Finally we can also save all plots and text files with posterior distributions to a directory, unless specified the default will be to create a file a directory called output in the current working directory. It is also possible to automatically save the output by adding a save=true keywords to fitABCmodels.
saveresults(out; resultsdirectory = "example")
saveallplots(out, resultsdirectory = "example")

