-
Notifications
You must be signed in to change notification settings - Fork 26
4 Lab Measurements
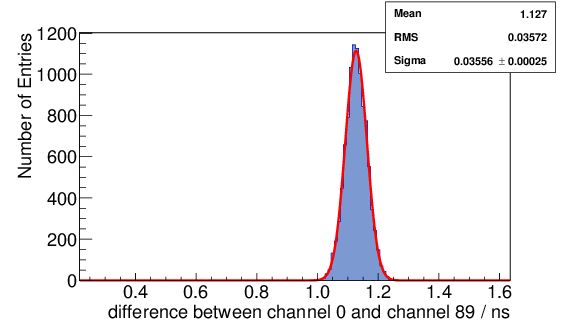
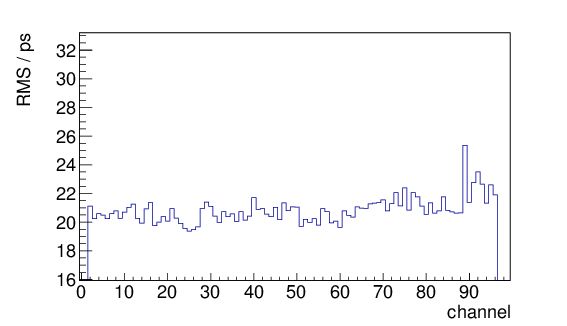
The jTDC resolution is measured by connecting two channels to the same source and calculating the difference. The worst channel during this test was channel 89, its gaussian distribution had an RMS of 36ps (left plot). For the true single channel resolution, the RMS result of the difference calculation must be divided by √2. For all channels a resolution of at least 30ps has been achieved (right plot).
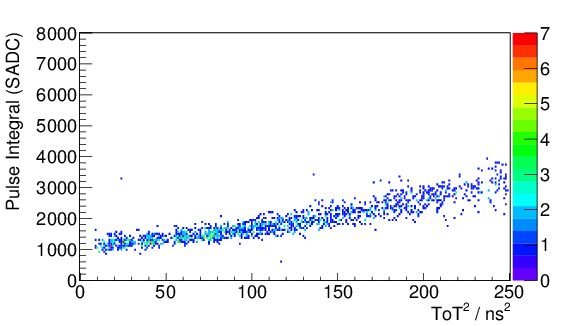
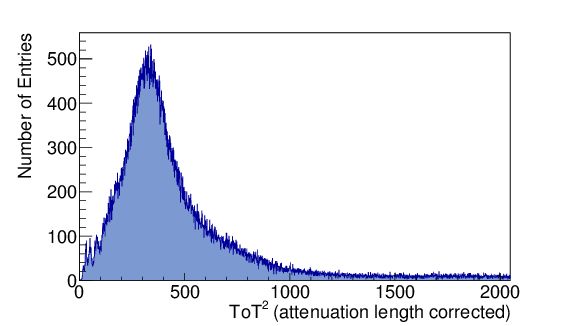
If the analog input card is used, time over threshold values from jTDC can be correlated to the pulse integral of an SADC (left plot). A standard ADC spectrum (without pedestal) can be extracted from the jTDC ToT data. Energy calibration is still needed (right plot).
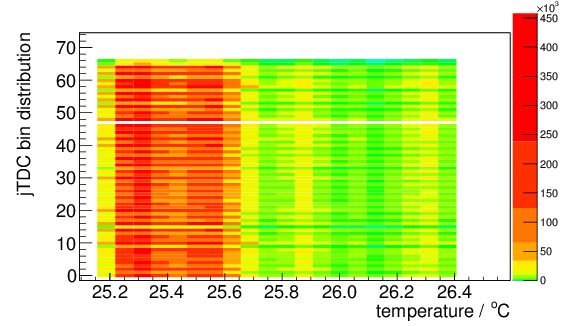
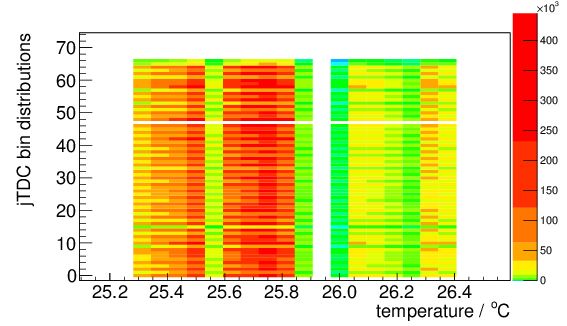
The jTDC is based on the white noise assumption, so it is important to verify, that the bin distribution is not temperature or rate dependent: The propagation time of the input signal through the TDL of the input sampler must stay constant during data taking. The following plots are generated using 1 week of data of a single channel (left plot low rate, right plot high rate runs). The color code can be ignored, it only shows how many runs have been recorded at a given temperature. The visible structures are much more interesting: They are hardware/FPGA dependent and would move to higher/lower bins, if the propagation time trough the TDL would increase/decrease due to temperature and/or rate dependencies. Even though temperature and rate changed during that week, the structures in the bin distributions did not.
