-
Notifications
You must be signed in to change notification settings - Fork 7
Testing and more
A code like Recentrifuge that emphasizes robustness in coding and results requires a robust testing procedure. Recentrifuge includes an automatic testing utility called retest that tests the other components of the package: retaxdump, remock, recentrifuge (rcf), and rextract. The test dataset included with Recentrifuge is designed to efficiently check and challenge various algorithms in the code, such as the robust contamination removal and the comparative metagenomics analysis. This dataset also triggers crossover contamination detection and removal. The results of the testing are straightforwardly interpreted.
After the installation of Recentrifuge from GitHub or PyPI, the automatic testing procedure is simply invoked with:
retest
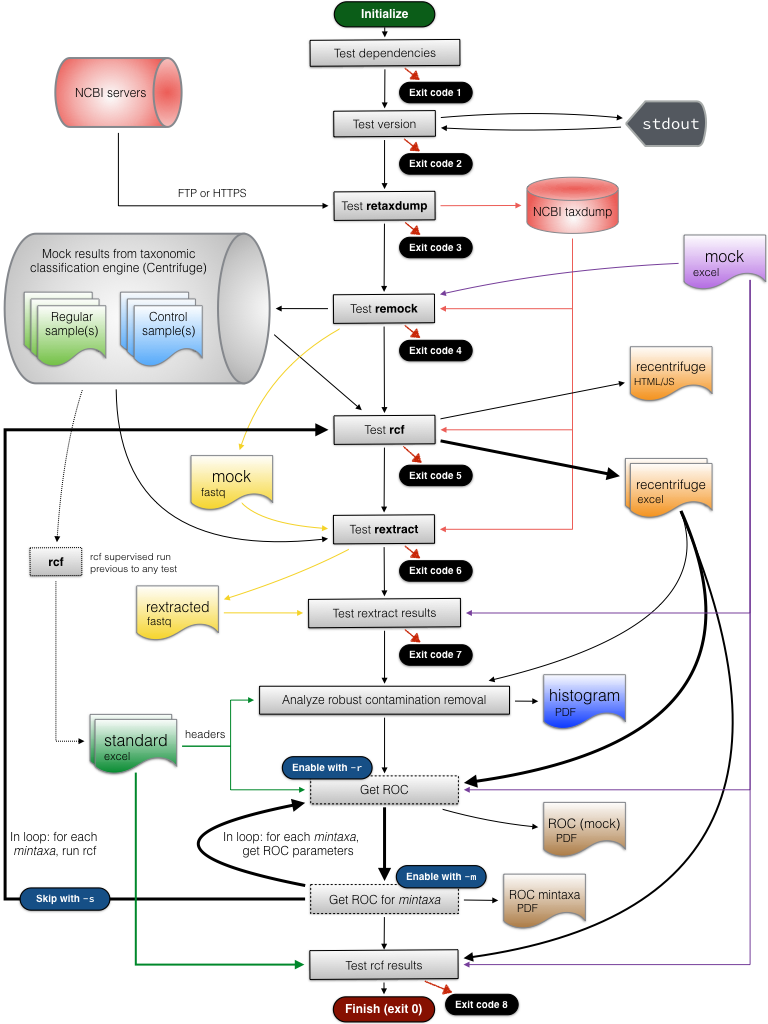
In typical use, the program performs different tests on the components of Recentrifuge package. If all the tests are passed, retest exits with code 0. An exit code different from 0 indicates the number of the testing stage that has failed. The flowchart below shows the main workflow of retest, including the relation of the different exit values to the testing steps:
The dotted lines indicate procedures previously completed to prepare the standard needed for comparisons in some stages of the testing workflow. The dashed lines denote optional procedures that are detailed in the subsection "Optional advanced procedures".
Beyond the testing of every component of Recentrifuge, retest analyzes the performance of Recentrifuge's robust contamination removal algorithm using specific mock data optimized for this purpose. This test produces a plot like the following:
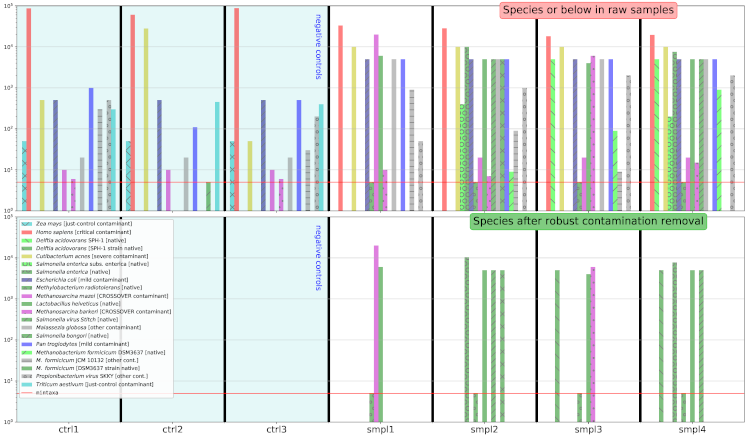
The top row of the figure shows the abundance histogram for some taxa in the dataset (7 raw samples: 4 samples plus 3 negative control samples) before the robust contamination removal algorithm goes into action. The bottom row shows the results after the algorithm intervention. Native taxa are green-colored, and crossover contaminants are colored in purple. The complete color code is detailed below, in the section "Understanding the messages of the robust contamination removal algorithm".
Additionally, retest includes some advanced procedures to obtain some graphics resulting from the check on specific features of the package:
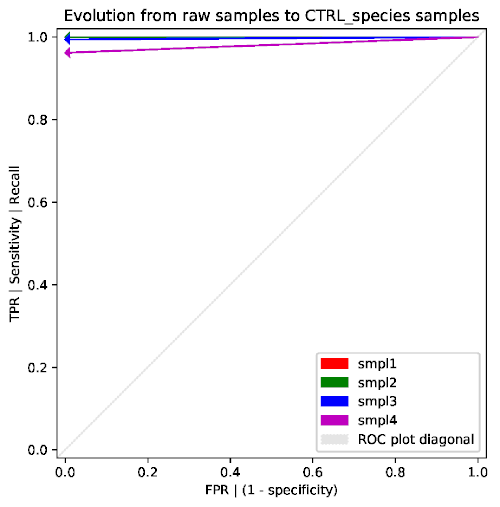
- If the flag
-ror--rocis activated,retestperforms additional tests and generates a ROC figure such as the following:
- The flag
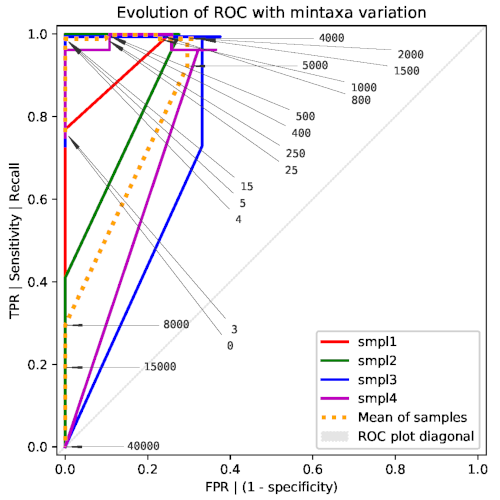
-mor--mintaxaenables additional tests for analyzing the dependency on themintaxaparameter. This study is time-consuming since it runsrcfin a loop with many different (forced) values ofmintaxa. The flag-sor--skippermits to reuse the results from a previous complete execution ofretestwith the-mflag, thus directly loading and analyzing the multiple results previously generated byrcf. This analysis produces a ROC plot like the following:
In retest:
- If the
-dor--debugflag is enabled,retestproduces a more verbose output. - If the
-ior--ignoreoption is active, the code continues testing even if errors arise. - If the
-lor--localflag is enabled,retestchecks the Recentrifuge scripts in the local directory (instead of the pip installed ones).
Recentrifuge uses Travis CI to ensure that any new change or improvement in the code do not break it or inadvertently change its behavior or results. Please see the Recentrifuge's Travis CI page. Travis CI runs the following command for each new commit or tag:
./retest -d -l -r
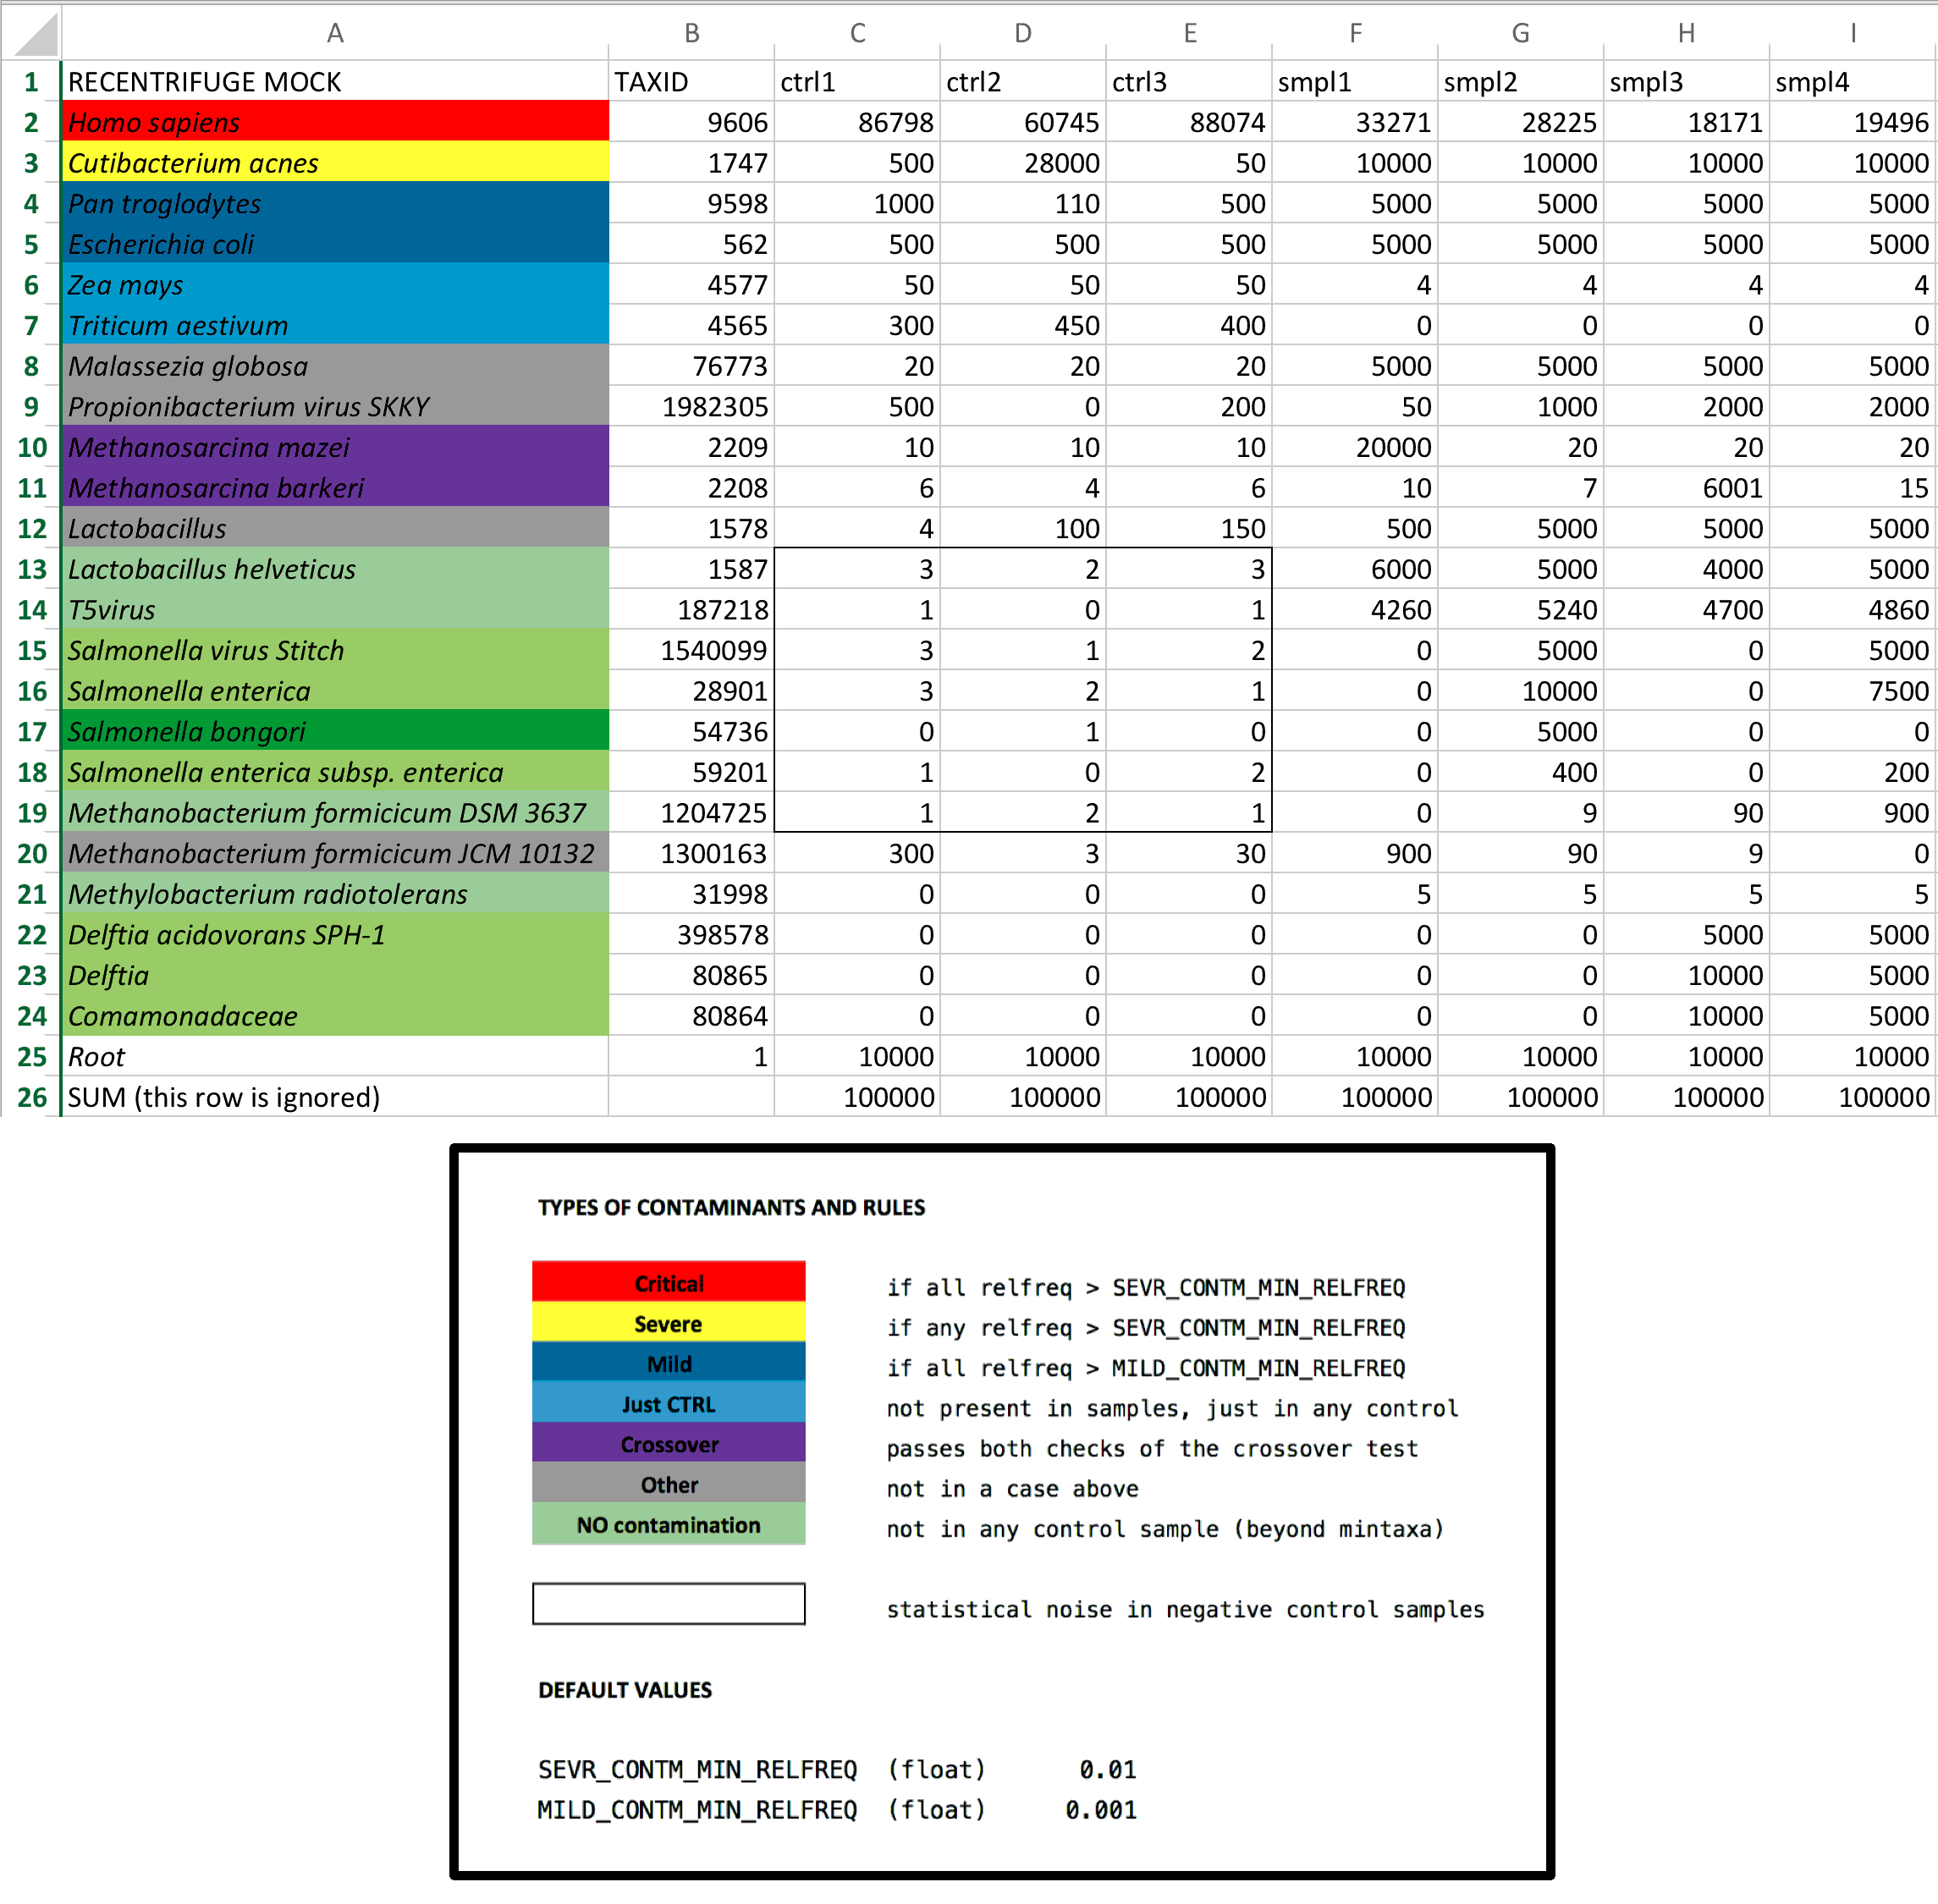
The following figure details the design of the mock community, which has been carefully devised to challenge the robust contamination removal algorithm of Recentrifuge.
The community contains diverse contaminant and native taxa. The role is indicated by a characteristic background color as shown in the legend of the figure. That color code is also observed by the detailed output of the robust contamination removal algorithm. Red, yellow and navy blue indicate, respectively, critical, severe, and mild contaminants. A purple background indicates crossover contaminants (those contaminating the samples except the source sample, where they are native). A green background characterizes native taxa, while the grey one stands for other contaminants. Spread over different orders of magnitude, the abundances are fine-tuned to challenge Recentrifuge algorithms and easily detect any problem during the testing. The black rectangle in the figure surrounds an area covering all the control samples and some native taxa spiked by low abundancies to simulate statistical noise in negative control samples such as low-frequency misclassifications and sequencing errors.
The taxa of the mock community cover the different domains of life and are mainly located at the taxonomic level of species or below, but there are also taxa belonging to other more general levels. Some taxa are intentionally introduced together to check Recentrifuge performance under difficult conditions. For instance, two strains of the archaea Methanobacterium formicicum were introduced: one native to the samples (M. formicicum DSM 3637) and another a contaminant (M. formicicum JCM 10132).
Retest triggers the parsing of the data shown in the figure by remock to create the mock dataset that rcf analyzes during its testing stage.
Beyond retest, we encourage you to play with this manual procedure as we consider it is a good approach to get a deep insight into Recentrifuge's novel methods. Additionally, these steps are also useful for preparing lists of known contaminants (like a list of laboratory contaminants) for Recentrifuge to be aware.
Let's start taking for granted that you have installed the code in ~/recentrifuge, you have already used retaxdump to populate ./taxdump and now you would like to test Recentrifuge. We will use remock to generate the test samples with desired taxa and abundances, as previously determined. For this manual procedure, we will no be using retest, the script that automatically tests Recentrifuge modules (see above).
Remock works in two separate modes of input and two distinct modes of generating datasets, for a total of four different combined modes. The inputs could be either a text file per sample belonging to the dataset or an excel with the complete information for the dataset. The generation of the dataset can be with a random score or based on a specific file (a Centrifuge output file). Now, we will detail the two modes of remock covering random score generation. Test datasets are available as both text files and an excel file.
NOTE: Although either option works to perform this step of the testing, for the sake of compactness, we will continue the testing procedure with the dataset contained in the excel file (see subsection below for proceeding with the recommended next step in this manual procedure).
In this example, remock will read the taxa and abundances from a collection of text files and use a random score generated with a minimum hit length (MHL) of 35. The text files should have an NCBI taxid, one per line, and its absolute abundance (counts) separated from the taxid by a tabulator. Comments are allowed with # at the beginning of the line. The following is an example of the beginning of a real file:
# CONTROL 1 MOCK LAYOUT FILE
# Homo sapiens
9606	600
# Cutibacterium acnes
1747	250
# E. coli
562	50
# Zea mays
4577	25
# Triticum aestivum
4565	3
The name of these files could be given to remock on a one-by-one basis, but for complex samples, it is more convenient just to pass a directory name to remock; remock will read all the *.mck files in the directory and generate the correspondent *.out (Centrifuge output) files. We will use the latter approach, and issue:
~/recentrifuge/remock -m ~/recentrifuge/test/ -r 35 -d
After loading the NCBI nodes and names files and populating internal data structures, remock will list and load the different mock files found in the directory provided after the -m argument. With the debugging -d argument in the command line, for each file, remock will write to the console details about the data loaded:
Processing ~/recentrifuge/test/ctrl1.mck file:
600 	reads for taxid	 9606 	( Homo sapiens )
250 	reads for taxid	 1747 	( Cutibacterium acnes )
50 	reads for taxid	 562 	( Escherichia coli )
25 	reads for taxid	 4577 	( Zea mays )
(...)
Generating ~/recentrifuge/test/ctrl1.out file... 1000 reads OK!
In this case, remock will read the taxa and abundances from an excel file and also use a random score generated with a minimum hit length (MHL) of 35. The excel file has a first row with the labels of the samples. The first column is merely informative, and its label should be RECENTRIFUGE MOCK. The second column contains the different taxids, and its label is TAXID. The last row is discarded and could contain useful info for the validation, such as the accumulated absolute frequencies per sample. This required format is more evident with a real example:

In this case, to ease the testing, the background colors of each taxon are related to the colors used in the debugging messages of the robust contamination removal algorithm. The name of the excel files is passed to remock using the -x argument:
~/recentrifuge/remock -x ~/recentrifuge/test/mock.xlsx -r 35 -d
Again, after loading the NCBI nodes and names files and populating internal data structures, since the debugging -d argument is present in the command line, remock will detail the data loaded:
          ctrl1  ctrl2  ctrl3  smpl1  smpl2  smpl3  smpl4
TAXID
9606     87130  60576  87130  34171  28324  18270  20396
1747       500  28000     50  10000  10000  10000  10000
9598      1000    110    500   5000   5000   5000   5000
562        500    500    500   5000   5000   5000   5000
(...)
1        10000  10000  10000  10000  10000  10000  10000
Generating ~/recentrifuge/test/ctrl1.out file... 100000 reads OK!
Generating ~/recentrifuge/test/ctrl2.out file... 100000 reads OK!
(...)
Generating ~/recentrifuge/test/smpl4.out file... 100000 reads OK!
Recentrifuge keeps the relative path of the samples, which is convenient in large repositories of metagenomic datasets. In this case, we will obtain the results relative to the test path, so we move to the testing directory and issue the following commands:
cd ~/recentrifuge/test
~/recentrifuge/rcf -f . -o myTEST.rcf.html -c 3 -y 35 -d
The -y argument (minscore) is optional, but we choose it here to be the value of the -r argument of remock, i.e., the MHL of the randomly generated score. If such value is higher than the chosen MHL, Recentrifuge will filter the reads with less score. We could use the -m argument (mintaxa) to disregard the automatic setting and force a specific value for the minimum taxa to avoid collapsing one level to the parent one. Please, see the Recentrifuge paper for further details and examples of both minscore and mintaxa.
The execution of Recentrifuge with the above command generates an HTML file (myTEST.rcf.html), an excel file (myTEST.rcf.xlsx), and detailed console output. The automatic validation of the results is performed by retest but, in this case, the manual validation of the results is achieved, either:
- Interactively, loading the HTML file in a javascript-enabled browser, and comparing the results in the hierarchical pie plots with the validation HTML file,
- Numerically, loading the excel file in a spreadsheet program and comparing with the results contained in the the validation Excel file,
- Procedurally, by directly comparing the console output to the the validation console output. For this to be feasible, the
-dargument should be present in the command line, so thatrcfwill print details and debugging information. Please see the next subsection for hints to understand and validate the detailed output of the robust contamination removal algorithm.
The -d in the rcf command line triggers detailed output and debugging information to the console. This is also true for the contamination removal algorithm, which prints details for the specific taxa selected as contaminants. For each taxon, this information can include the type of contaminant, the values of the thresholds of the crossover tests (lims), the relative frequency of the taxon in each sample of the study (relfrec), and the detection of crossovers with the source samples, if any.
In text consoles supporting color, the output is colored with different meanings, for example, the name of the taxon is colored according to the type of contaminant. The colors, types of contaminants and rules are the following:
 where the default values for the parameters are:
SEVR_CONTM_MIN_RELFREQ: float = 0.01
MILD_CONTM_MIN_RELFREQ: float = 0.001
These and other parameters of the robust contamination removal algorithm are loaded from the file recentrifuge/params.py so that the user can easily modify their values from their defaults.
The two values after lims are the limits imposed on the taxon relative frequency by both tests of the crossover check (colored in green): the first is from the outlier test, and the latter is from the order of magnitude test. After, the taxon relative frequency for the controls and other samples is shown.
Please see the Recentrifuge paper for a detailed discussion of the robust contamination removal algorithm, including the crossover check.
In the legacy test dataset for manual validation, for the case of the taxonomic level of "species" we had:
Analysis for taxonomic rank "species":
   (...)
Robust contamination removal: Searching for contaminants...
critical:	 9606 Homo sapiens relfreq: [0.9, 0.6, 0.9][0.3, 0.3, 0.2, 0.2]
other cont:	 1982305 Propionibacterium virus SKKY lims: [0.09]<[5] relfreq: [0.005, 0, 0.002][0.0005, 0.01, 0.02, 0.02]
mild cont:	 562 Escherichia coli relfreq: [0.005, 0.005, 0.005][0.05, 0.05, 0.05, 0.05]
mild cont:	 9598 Pan troglodytes relfreq: [0.01, 0.001, 0.005][0.05, 0.05, 0.05, 0.05]
crossover:	 2209 Methanosarcina mazei lims: [0.002]<[0.1] relfreq: [0.0001, 0.0001, 0.0001][0.2, 0.0002, 0.0002, 0.0002] crossover: [T, F, F, F]
	-> Include 2209 just in: smpl1
just-ctrl:	 4565 Triticum aestivum relfreq: [0.003, 0.004, 0.004][0, 0, 0, 0]
other cont:	 76773 Malassezia globosa lims: [0.08]<[1e+01] relfreq: [0, 0.002, 0.01][0.05, 0.05, 0.05, 0.05]
crossover:	 2208 Methanosarcina barkeri lims: [0.0009]<[0.06] relfreq: [6e-05, 0, 6e-05][0.0001, 7e-05, 0.06, 0.0001] crossover: [F, F, T, F]
	-> Include 2208 just in: smpl3
just-ctrl:	 4577 Zea mays relfreq: [0.0005, 0.0005, 0.0005][0, 0, 0, 0]
severe: 	 1747 Cutibacterium acnes relfreq: [0.005, 0.3, 0.0005][0.1, 0.1, 0.1, 0.1]
In a console supporting color, the output was colored:

The taxa and colors of the detected contaminants should match the ones in the excel file of the test dataset, so we finally had:
- Critical contamination (in red): Homo sapiens.
- Severe contamination (in yellow): Cutibacterium acnes
- Mild contamination (in blue): Escherichia coli and Pan troglodites
- Contamination exclusive to controls (in cyan): Triticum aestivum and Zea mays
- Crossover contamination (in purple):
-
Methanosarcina mazei, with sample
smpl1as source, and contaminating all the samples -
M. barkeri, with sample
smpl3as source, and contaminating all the samples except the 2nd negative control.
-
Methanosarcina mazei, with sample
- Other contamination (in grey): Propionibacterium virus SKKY and Malassezia globosa
If you use Recentrifuge in your research, please consider citing the paper. Thanks!
Martí JM (2019) Recentrifuge: Robust comparative analysis and contamination removal for metagenomics. PLOS Computational Biology 15(4): e1006967. https://doi.org/10.1371/journal.pcbi.1006967
