-
Notifications
You must be signed in to change notification settings - Fork 2
Performance evaluation
- Go to evaluation section
- Go to evaluation section
- Raw results: XForm_CS_PS_Performance.xlsx
- Go to evaluation section
- Raw results CodeGenerator_ClientServer.xlsx, CodeGenerator_PublishSubscribe.xlsx
You can also find the results in CSV format here.
Scenarios describe the structure of the input CPS model using a set of constraints and the model generator can be executed to create models with the appropriate size. These input models are then used to evaluate the performance of the alternative transformation implementations.
This scenario creates a server host type with a single instance and a client host type with increasing number of instances. A server application type with a single instance is allocated to the server host instance and client application types with one instance each are allocated to client hosts. The state machine of the server application contains 30 states, 40 transitions (with 13-14 containing wait actions). The client application types define small state machines with 3 states, 5 transitions (with 0-2 send actions). All client hosts communicate with the server host only.
This scenario results in a star-like structure where there are a large number of triggers from clients to the server.
This scenario is the inverse of the Client-Server scenario, with a single publisher and a large number of subscribers. The single publisher host communicates with all subscribers and the publisher state machine contains send actions that trigger some of the wait actions of the transitions of the subscriber state machine.
This scenario generates multiple host types each with multiple instances that are interconnected. It also creates a number of application types with 1-3 instances and state machines with 5-9 states and 10-15 transitions (with 10% of the transitions have actions, 50% send and 50% wait). Only 30% of the applications are allocated to hosts.
This scenario generates multiple host types each with multiple instances that are interconnected. It also creates a number of application types with 5-10 instances and state machines with 5-7 states and 7-10 transitions (with 30% of the transitions have actions, 30% send and 70% wait). Only 30% of the applications are allocated to hosts.
The performance of the Generator can be tested with predefined scenarios. Scenarios define scalable ICPSConstraints. The output of the generator is depending on the input of the scenario (scale).
| Scale | CPS EObjects | CPS EReferences | Generating Time (ms) |
|---|---|---|---|
| 1 | 196 | 329 | 5 |
| 8 | 976 | 1679 | 10 |
| 16 | 1876 | 3239 | 17 |
| 32 | 3646 | 6299 | 32 |
| 64 | 7196 | 12439 | 62 |
| 128 | 14266 | 24659 | 151 |
| 256 | 28396 | 49079 | 348 |
| 512 | 56616 | 97839 | 1836 |
| 1024 | 113036 | 195319 | 3088 |
| Scale | CPS EObjects | CPS EReferences | Generating Time (ms) |
|---|---|---|---|
| 1 | 196 | 329 | 4 |
| 8 | 976 | 1679 | 9 |
| 16 | 1876 | 3239 | 15 |
| 32 | 3646 | 6299 | 27 |
| 64 | 7196 | 12439 | 61 |
| 128 | 14266 | 24659 | 140 |
| 256 | 28396 | 49079 | 323 |
| 512 | 56616 | 97839 | 1144 |
| 1024 | 113036 | 195319 | 4231 |
| Scale | CPS EObjects | CPS EReferences | Generating Time (ms) |
|---|---|---|---|
| 1 | 2401 | 4042 | 659 |
| 8 | 21193 | 35580 | 627 |
| 16 | 37638 | 62993 | 411 |
| 32 | 85406 | 143807 | 788 |
| 64 | 150915 | 253494 | 1152 |
| 128 | 340656 | 574093 | 2701 |
| 256 | 606887 | 1025244 | 5502 |
| 512 | 1253827 | 2122556 | 15044 |
| 1024 | 2434477 | 4157629 | 37956 |
| Scale | CPS EObjects | CPS EReferences | Generating Time (ms) |
|---|---|---|---|
| 1 | 680 | 1196 | 9 |
| 8 | 5481 | 10094 | 39 |
| 16 | 9609 | 17773 | 66 |
| 32 | 22151 | 40538 | 161 |
| 64 | 39227 | 72476 | 287 |
| 128 | 88698 | 163228 | 1772 |
| 256 | 158506 | 290397 | 1990 |
| 512 | 327234 | 600214 | 3459 |
| 1024 | 642467 | 1171992 | 11969 |
For the transformation alternatives we measure the runtime and memory usage of each implementation with the Client-Server and Publish-Subscribe scenarios.
The runtime is measured for the first transformation (with the model already loaded into EMF) and the aggregated time of adding a new allocated client (subscriber) application instance and re-transformation.
The memory usage is measured:
- after generation (where only the model is loaded)
- after initialization of the transformation (where the VIATRA Query engine is already initialized for the needed patterns where used)
- after execution of the transformation
The results from the Client-Server scenario with 5 M2M transformation alternatives with model scales between 1 and 4096 are included in this section. The results for Publish-Subscribe are available in raw form in the repository.
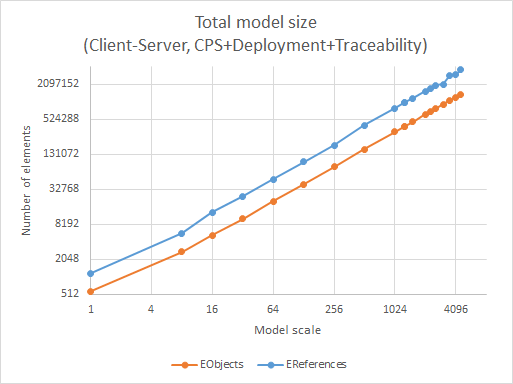
The total size of the models for the different scales are visualized in Figure 1. The number of objects and references are measured after the execution of the transformation and include all three models (CPS, deployment and traceability). Note that both axes of the graph use logarithmic scale (power 2).

The number of objects reaches 1.4 million, while the number of references is more than 3.75 million in the largest model. The generator performs well in creating models with linear increase with scale.
The runtime of the transformations is measured twice, the first graph in Figure 2 shows the time required to execute the transformation for the first time, where the CPS model is already generated, but the deployment and traceability models are empty. The second graph in Figure 3 shows the time required to modify the CPS model by adding a client application instance and allocate it to a client host instance then executing the transformation again. Note that both axes of the graphs use logarithmic scale (power 2).

We used time limits in the performance tests, 100 seconds for the smallest scales (1-8), 300 seconds for 16, 10 minutes for larger scales (32-4096).
- As the graph shows both the simple and optimized Xtend batch transformations hit this limit for models above scale 128, while they are only faster than the other variants on the smallest models.
- The Xtend and VIATRA Query batch variant is the fastest on large models, while the explicit traceability and query result bookmarking variants go head-to-head with one order of magnitude slower.

The time spent on the modification and re-transformation clearly shows the advantage of incremental variants, while batch variants take almost exactly the same time to finish as for the first transformation.
- The two incremental variants perform several orders of magnitude faster than any of the batch transformations.
- The query result bookmarking transformation is slightly slower, but the difference is small. It is probably because the explicit traceability transformation uses a bit more optimized patterns, but it should be evaluated further.
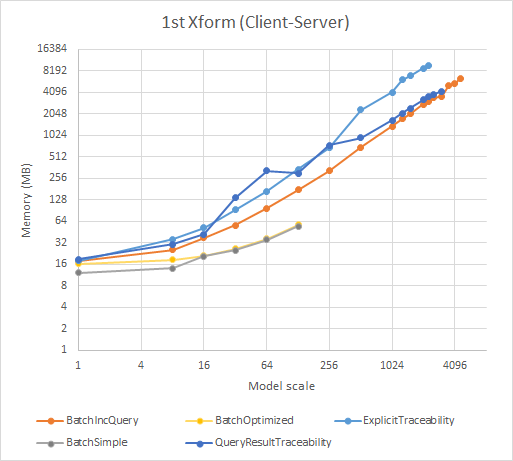
The steady-state memory usage after the execution of the transformation is shown in Figure 4. The measured value is the total used heap space of the JVM, after 5 manually triggered garbage collections and 1 second sleep. This method is used to ensure that all temporary objects are collected. Note that both axes of the graphs use logarithmic scale (power 2).

- Although the simple and optimized Xtend batch transformations use the least amount of memory, there is not much to learn from those values, since they could only finish on small models.
- The memory usage of the three EMF-IncQuery based variants is quite close, with the explicit traceability variant using the most memory due to its more complex queries and larger number of rules.
- The query result bookmarking variant uses less memory than the explicit traceability and is very close to the batch EMF-IncQuery variant (especially on larger models).
The results presented in this section can be used as an initial evaluation of several different transformation variants. It also shows, that a query engine that scales well for complex queries and large models is very important for developing model transformations. Finally, the results demonstrate that it is possible to create an incremental transformation that has the same characteristics for the first execution as batch variants, but offers very fast synchronization on changes.
For the code generation, we used the deployment models created for Client-Server scenario by the M2M transformation. We measured the resulting code size (in number of characters), the runtime of the code generation for the complete model and the memory usage after the code generation has finished. Note that these results show only the results for generating the complete model, while incremental synchronization of source code is not yet evaluated. Additionally, file handling is not included, only the generation of source code as string.
We have measured the performance of the code generation for the deployment model in the Client-Server scenario for model scales 8-1024.
The total size of the source code for the different scales are visualized in Figure 5. Note that both axes of the graphs use logarithmic scale (power 2) and the number of characters is shown in thousands.

The graph shows that the size of the generated code also increases linearly, similarly to the model size in the M2M transformation.
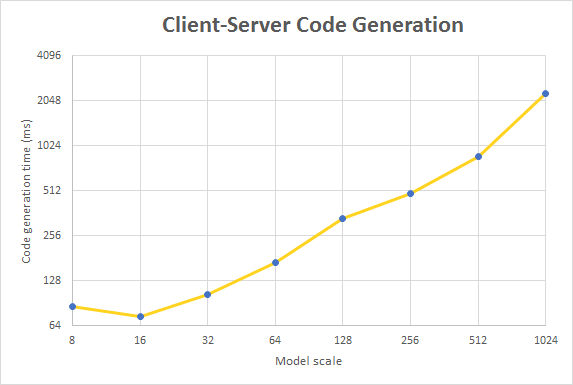
The runtime of the code generation for the different model scales is shown in Figure 6. Note that both axes of the graphs use logarithmic scale (power 2).

Since there is only one implementation, there is no real comparison to make yet. However, compared to the runtime of the transformation, the time to generate the source code is minor.
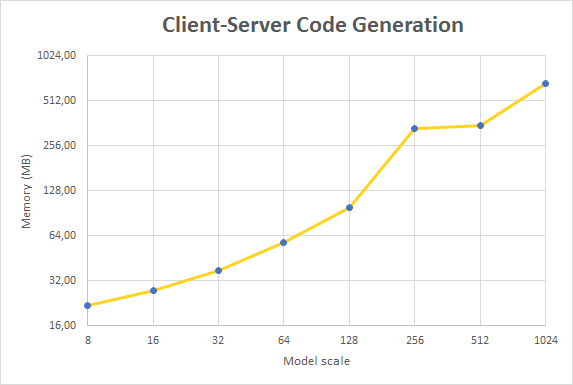
The steady-state memory usage after the execution of the code generation is shown in Figure 7. Note that both axes of the graphs use logarithmic scale (power 2).

The memory usage of the code generator is less than the M2M transformation since it uses fewer queries and those are focused on the deployment model only.
Theses measurements already show that the source code generation is feasible, but the evaluation of other variants are necessary in the future.