
Charty is open-source Ruby library for visualizing your data in a simple way. In Charty, you need to write very few lines of code for representing what you want to do. It lets you focus on your analysis of data, instead of plotting.

$ brew install Python
$ pip3 install matplotlib
$ bundle
You should install tk libraries before install python and should add enabling shared library option to installing python.
So you may have to do pyenv uninstall 3.x.x first.
$ apt install -y tk-dev python3-tk
$ CONFIGURE_OPTS="--enable-shared" pyenv install 3.x.x
sudo gem install charty --pre
sudo gem install matplotlib
sudo apt install python3-pip
sudo python3 -m pip install -U pip matplotlib
e.g.
$ bundle install
$ docker build -f ./Dockerfile.dev -t charty-dev:0.1 .
$ docker run -it -v ${PWD}:/charty -w /charty charty-dev:0.1 ./bin/console
irb(main):001:0> Charty::VERSION
=> "0.1.4-dev"

# When using jupyter notebook
$ docker run -it -v ${PWD}:/charty -w /charty -p 8888:8888 charty-dev:0.1
require 'charty'
charty = Charty::Plotter.new(:pyplot)
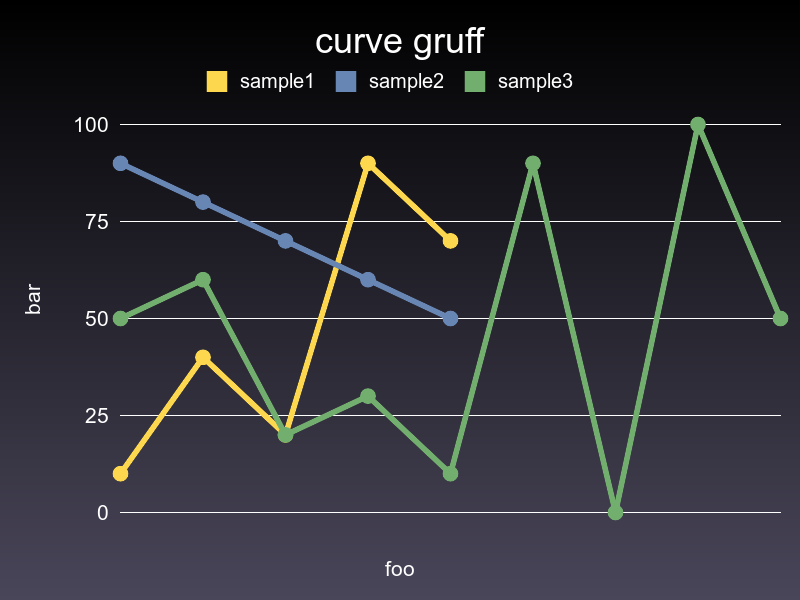
bar = charty.bar do
series [0,1,2,3,4], [10,40,20,90,70], label: "sample1"
series [0,1,2,3,4], [90,80,70,60,50], label: "sample2"
series [0,1,2,3,4,5,6,7,8], [50,60,20,30,10, 90, 0, 100, 50], label: "sample3"
range x: 0..10, y: 1..100
xlabel 'foo'
ylabel 'bar'
title 'bar plot'
end
bar.render("sample_images/bar_pyplot.png")Charty also supports Daru::DataFrame, Numo::NArray, NMatrix and ActiveRecord as Data Abstraction Layer. For example.
require 'charty'
charty = Charty::Plotter.new(:pyplot)


### when Daru::DataFrame
require 'daru'
df = Daru::DataFrame.new({'a':[1,2,3,4], 'b':[4,5,6,7], 'c':[8, 9, 10, 11]})
charty.table = df


### when Numo::NArray
require "numo/narray"
narray = Numo::DFloat.new(3,5).seq
charty.table = narray


### when NMatrix
require "nmatrix"
nmatrix = NMatrix.new([3, 4], [0, 1, 2, 3, 4, 5, 6, 7, 8, 9, 10, 11], dtype: :int64)
charty.table = nmatrix


### when ActiveRecord
require "active_record"
ActiveRecord::Base.establish_connection(adapter: "sqlite3", database: ":memory:")
ActiveRecord::Schema.define do
  create_table :foos do |t|
    t.integer :price
    t.integer :sales
  end
end
class Foo < ActiveRecord::Base
end
100.times{|i| Foo.create!(price: 10 * i, sales: (1..100).to_a.sample) }
sales = Foo.where("sales >= 40")
charty.table = sales


bar = charty.to_bar(:price, :sales)
bar.render('sample')

box_plot = charty.to_box_plot(:price, :sales)
box_plot.render('sample')

bubble = charty.to_bubble(:price, :sales, :id)
bubble.render('sample')

curve = charty.to_curve(:price, :sales)
curve.render('sample')

scatter = charty.to_scatter(:price, :sales)
scatter.render('sample')

error_bar = charty.to_error_bar(:price, :sales)
error_bar.render('sample')

hst= charty.to_hst(:price, :sales)
hst.render('sample')create an instance of the library you want to use.
require 'charty'
# when you want to use matplotlib.pyplot
charty = Charty::Plotter.new(:pyplot)
# when you want to use gruff
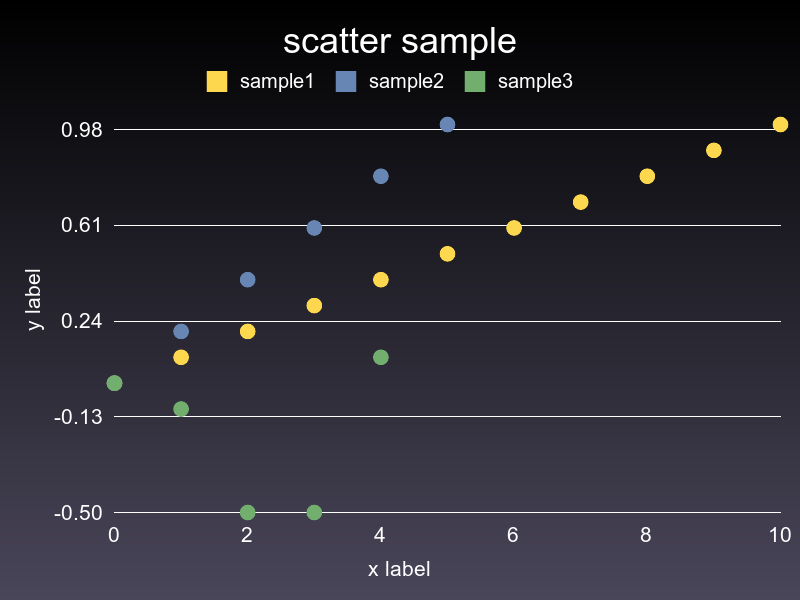
charty = Charty::Plotter.new(:gruff)
# when you wanto to use rubyplot
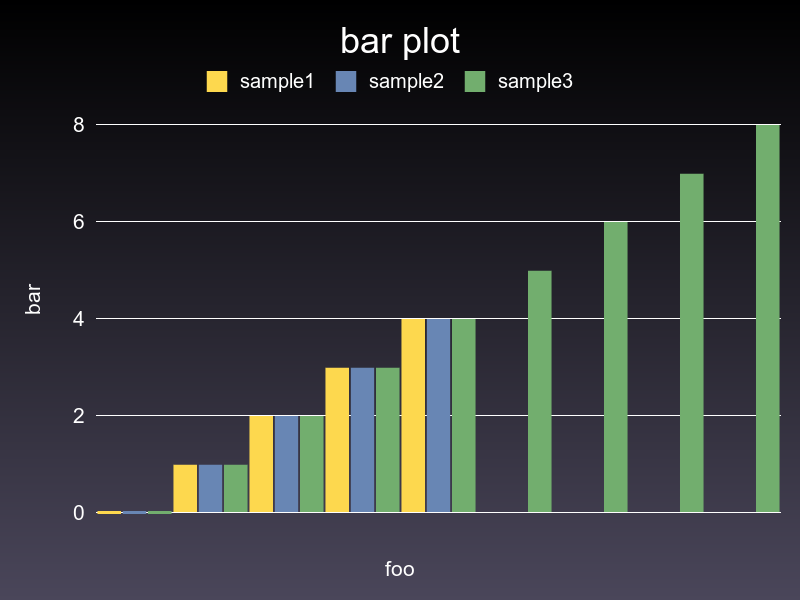
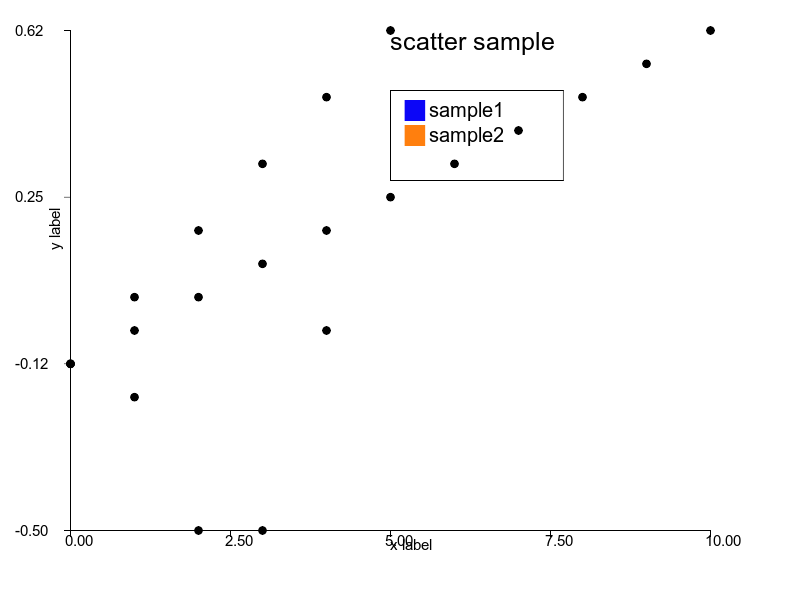
charty = Charty::Plotter.new(:rubyplot)bar = charty.bar do
series [0,1,2,3,4], [10,40,20,90,70], label: "sample1"
series [0,1,2,3,4], [90,80,70,60,50], label: "sample2"
series [0,1,2,3,4,5,6,7,8], [50,60,20,30,10, 90, 0, 100, 50], label: "sample3"
range x: 0..10, y: 1..100
xlabel 'foo'
ylabel 'bar'
title 'bar plot'
end
bar.render("sample_images/bar_pyplot.png")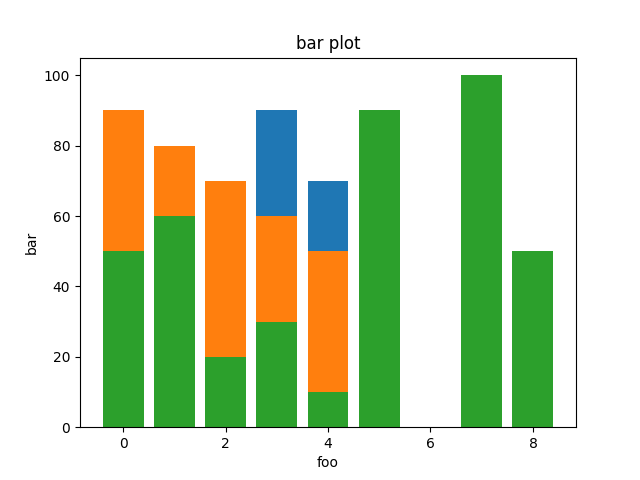
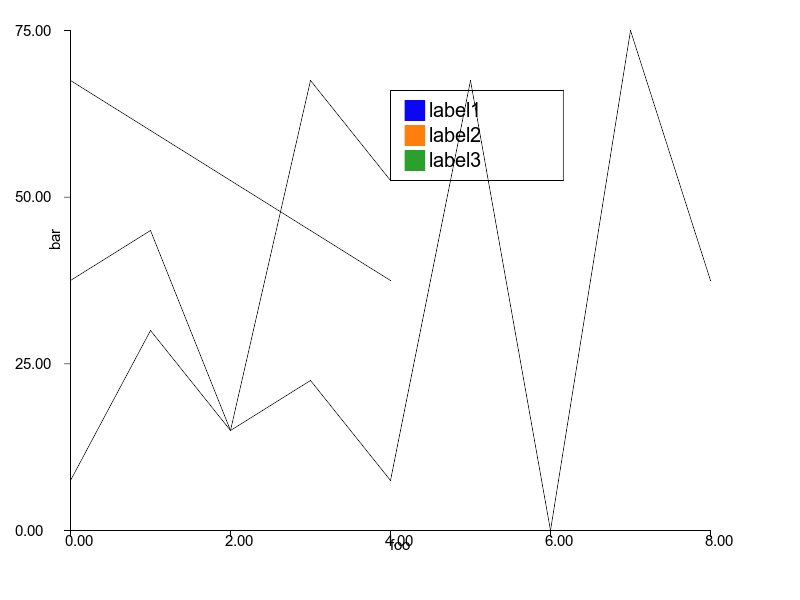
curve2 = charty.curve do
  series [0,1,2,3,4], [10,40,20,90,70], label: "sample1"
  series [0,1,2,3,4], [90,80,70,60,50], label: "sample2"
  series [0,1,2,3,4,5,6,7,8], [50,60,20,30,10, 90, 0, 100, 50], label: "sample3"
  range x: 0..10, y: 1..100
  xlabel 'foo'
  ylabel 'bar'
end
curve2.render("sample_images/curve_pyplot.png")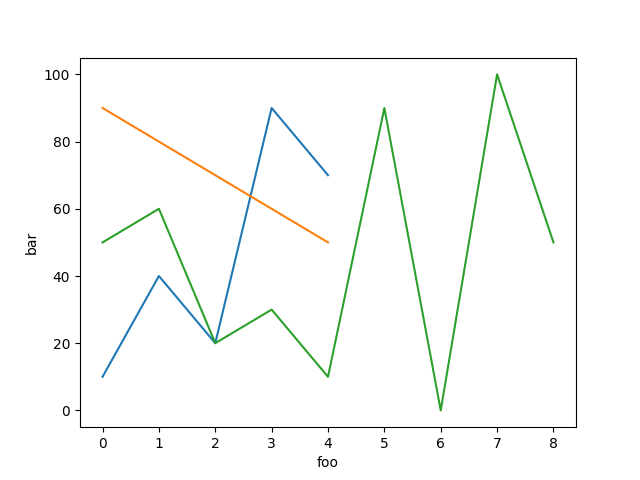
curve = charty.curve do
  function {|x| Math.sin(x) }
  range x: 0..10, y: -1..1
  xlabel 'foo'
  ylabel 'bar'
end
curve.render("sample_images/curve_with_function_pyplot.png")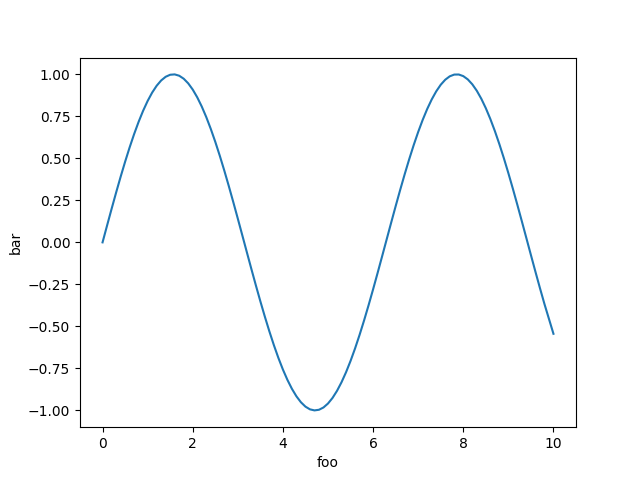
Not supported
box_plot = charty.box_plot do
  data [[60,70,80,70,50], [100,40,20,80,70], [30, 10]]
  range x: 0..10, y: 1..100
  xlabel 'foo'
  ylabel 'bar'
  title 'box plot'
end
box_plot.render("sample_images/box_plot_pyplot.png")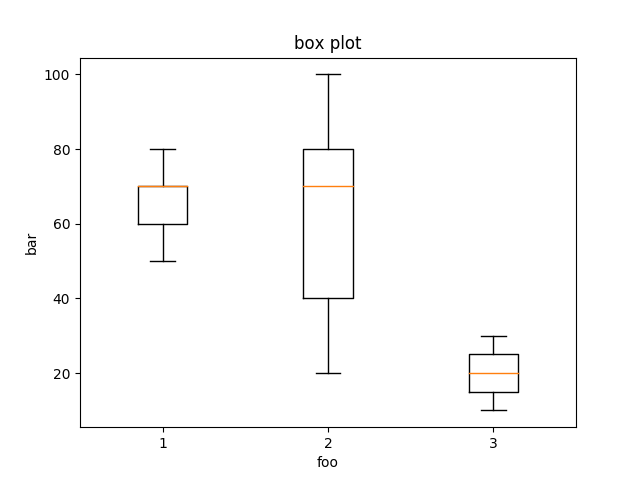
Not supported
Not supported
scatter = charty.scatter do
  series 0..10, (0..1).step(0.1), label: 'sample1'
  series 0..5, (0..1).step(0.2), label: 'sample2'
  series [0, 1, 2, 3, 4], [0, -0.1, -0.5, -0.5, 0.1], label: 'sample3'
  range x: 0..10, y: -1..1
  # xlabel 'x label'
  # xlabel ''
  ylabel 'y label'
  title 'scatter sample'
end
scatter.render("sample_images/scatter_pyplot.png")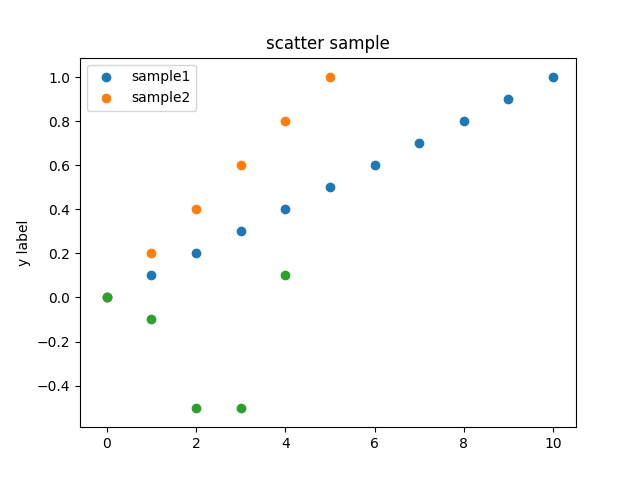
error_bar = charty.error_bar do
  series [1,2,3,4], [1,4,9,16], xerr: [0.5,1.0,1.5,0.3], yerr: [0.6,0.2,0.8,0.1], label: 'label1'
  series [1,2,3,4], [16,9,4,1], label: 'label2'
  series [1,2,3,4,5,6,7,8], [14,14,14,14,14,14,14,14], label: 'label2', xerr: [0.5,1.0,1.5,0.3, 1.1, 1.2, 1.3, 1.4]
  range x: 0..10, y: -1..20
  xlabel 'x label'
  title 'error_bar'
end
error_bar.render("sample_images/error_bar_pyplot.png")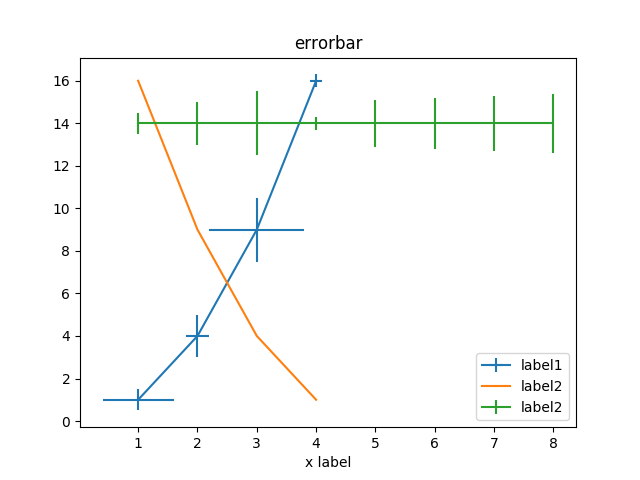
Not supported
Not supported
bubble = charty.bubble do
  series 0..10, (0..1).step(0.1), [10, 100, 1000, 20, 200, 2000, 5, 50, 500, 4, 40], label: 'sample1'
  series 0..5, (0..1).step(0.2), [1, 10, 100, 1000, 500, 100], label: 'sample2'
  series [0, 1, 2, 3, 4], [0, -0.1, -0.5, -0.5, 0.1], [40, 30, 200, 10, 5]
  range x: 0..10, y: -1..1
  xlabel 'x label'
  ylabel 'y label'
  title 'bubble sample'
end
bubble.render("sample_images/bubble_pyplot.png")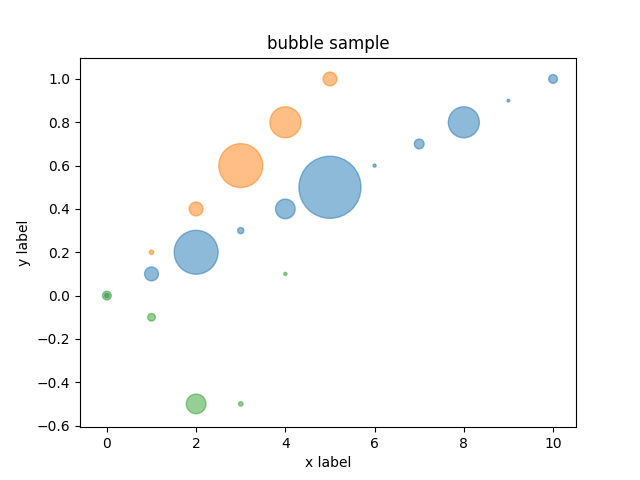
Not supported
hist = charty.hist do
  data [[10, 10, 20, 30, 40, 40,40,40,40,40, 50, 10, 10, 10], [100, 100, 100, 100, 90, 90, 80, 30, 30, 30, 30, 30]]
  range x: 0..100, y: 0..7
  xlabel 'x label'
  ylabel 'y label'
  title 'histogram sample'
end
hist.render("sample_images/hist_pyplot.png")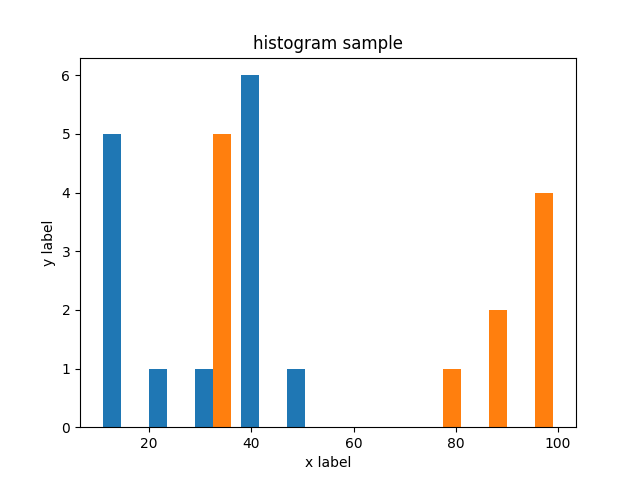
Not supported
Not supported
layout = charty.layout
layout << curve
layout << scatter
layout.render("sample_images/subplot_pyplot.png")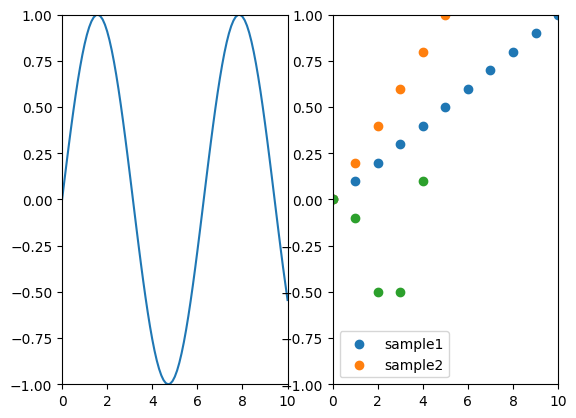
Not supported
Not supported
curve_list = [0.5, 0.75].map do |f|
  charty.curve(f:f) do
    function {|x| Math.sin(f*x) }
    range x: 0..10, y: -1..1
  end
end

scatter_list = [-0.5, 0.5].map do |f|
   charty.scatter(f: f) do
    series Charty::Linspace.new(0..10, 20), Charty::Linspace.new(0..f, 20)
    range x: 0..10, y: -1..1
  end
end

grid_layout = charty.layout(:grid2x2)
grid_layout << curve_list
grid_layout << scatter_list
grid_layout.render("sample_images/subplot2_pyplot.png")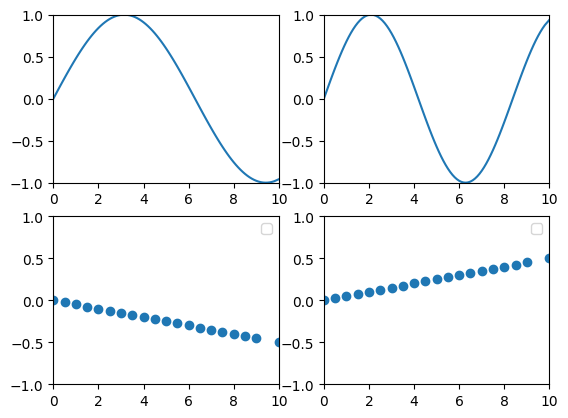
Not supported
Not supported
- The concepts of this library is borrowed from Python's HoloViews and Julia's Plots ecosystem.
- Kenta Murata <[email protected]>
- Kazuma Furuhashi <[email protected]>
MIT License