-
Notifications
You must be signed in to change notification settings - Fork 18
Tutorial Synthetic Data II
In this part we will tune some parameters to optimize the automatic sorting result from Part I.
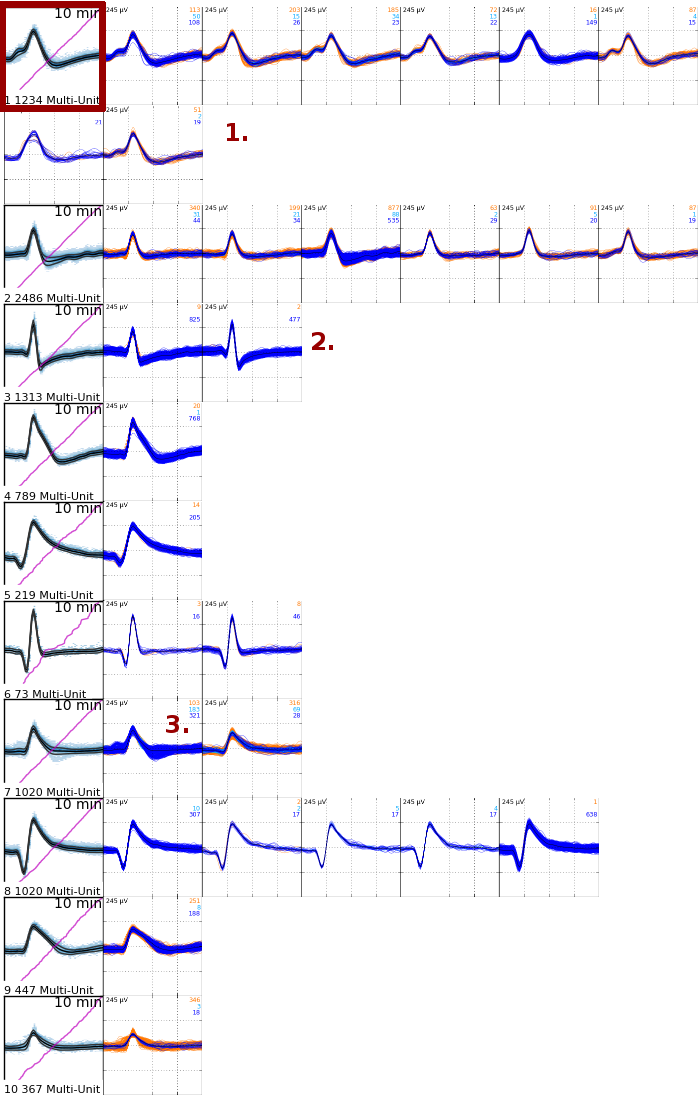
We saw that Combinato created the following clustering result:

The problems are (the numbers refer to the red numbers in the plot):
- A cluster was wrongly designated an artifact.
- Some spikes were not assigned to any cluster.
- This is a multi-unit that should be further split apart.
- There are some spikes in this unit that should not be part of it.
Create a file called local_options.py in the same folder that contains the simulation_5 folder. The content of the file is the following:
options = {'MaxClustersPerTemp': 7,
           'RecursiveDepth': 2,
           'MinInputSizeRecluster': 1000,
           'MaxDistMatchGrouping': 1.6,
           'MarkArtifactClasses': False,
           'RecheckArtifacts': False}
Then re-run the clustering procedure. At this point, you should use a different label. Labels are names under which the clustering results are stored. By using different labels, you can save different clustering results from the same data and compare them later. So just enter
css-simple-clustering --datafile simulation_5/data_simulation_5.h5 --label optimized.
When the process is finished, enter
css-plot-sorted --label sort_pos_optimized.
(The prefix sort_pos_ is automatically prepended to the label).
The sorting results are much better now:

As you can see, with the optimized options, Combinato generated 10 units. Each unit is displayed as a density plot along with its cumulative spike count (see the red frame for an example). Just next to the density plots, there is a list of all subclusters the unit consists of.
- Unit 1 consists of 8 subclusters. Probably the 5th and 7th subclusters should be made a different unit.
- Unit 3 consists of 2 subclusters. These are very different and should be split into two units using
css-gui. - Unit 7 consists of 2 subclusters. The first of these could be split further apart.
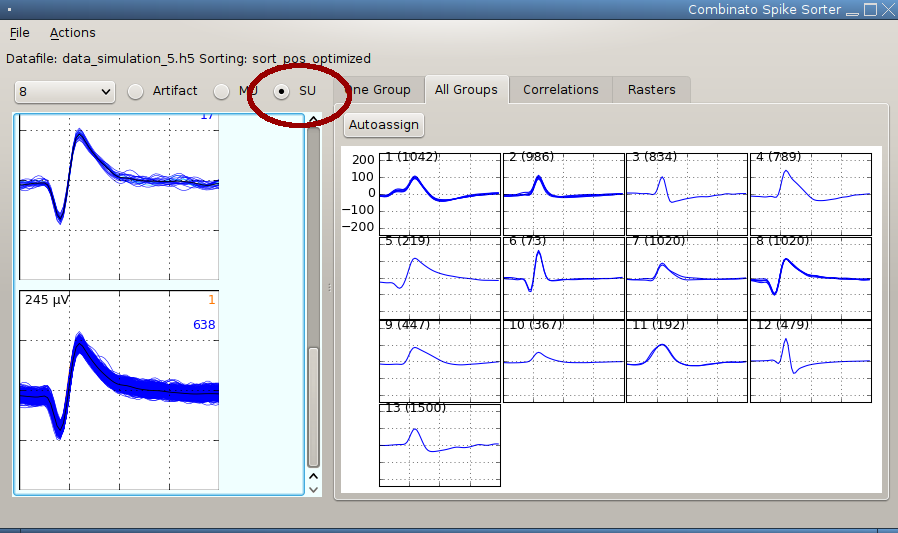
As explained in Part I, use css-gui to further split apart under-clustered units. You can also set units to Single Unit in css-gui (all units are considered multi-units by default):

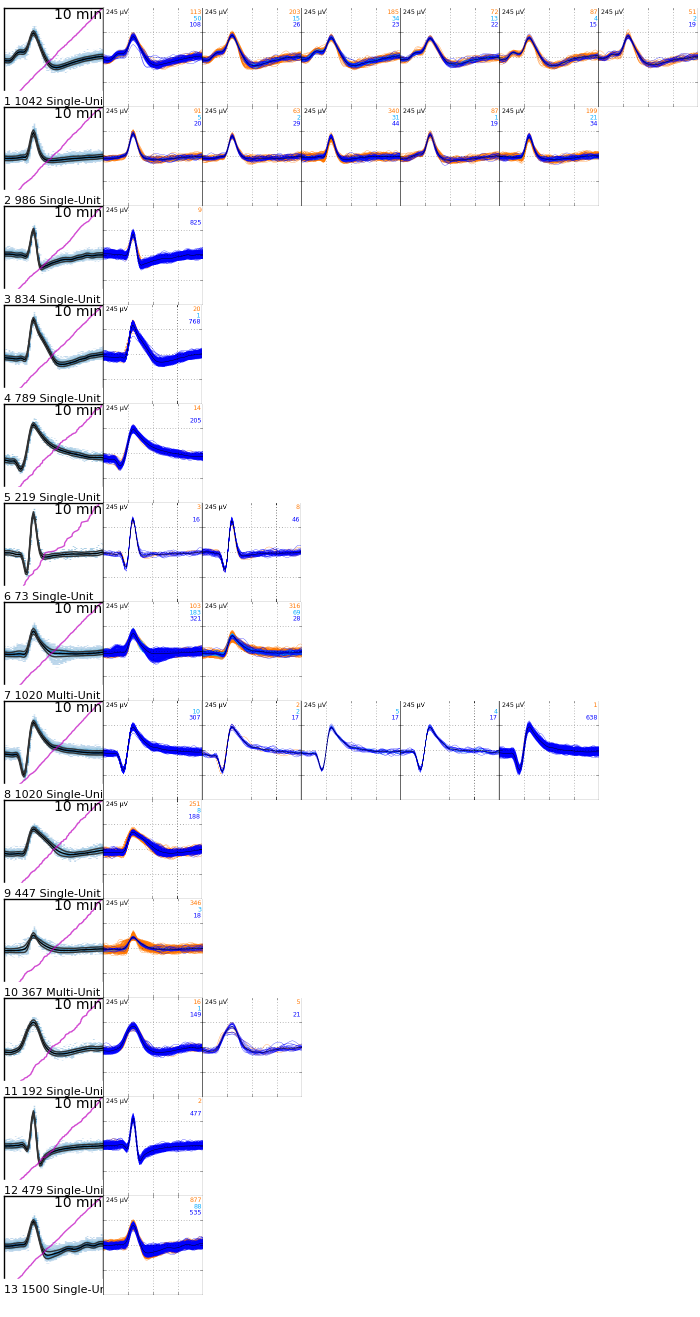
If you then save your modifications and re-plot the results (css-plot-sorted --label sort_pos_optimized), the result will be this:

This is a rather nice result. Congratulations!
You can now move on to Part III of the tutorial and finally work with real data.