-
Notifications
You must be signed in to change notification settings - Fork 16
Workflow Carpenter lab
Biological problems addressed by your group that use morphological profiling and types of perturbations that are profiled.
- Biological problems: Identifying mechanism-of-action of compounds based on similarity, enriching chemical libraries by maximizing dissimilarity, identifying compounds with similar phenotypic impact but different structures (lead-hopping), identifying drug targets by similarity-matching gene and compound profiles, grouping disease-associated alleles, functional annotation of genes based on similarity, identifying signatures associated with disease.
- Types of perturbations: Compounds, knockdown using RNAi reagents (soon, CRISPR), overexpression using ORF constructs, patient cells.
Use image analysis software to extract features from images. This results in a data matrix where the rows correspond to cells in the experiment and the columns are the extracted image features.
- We use CellProfiler to segment cells and extract features.
- For handling illumination artifacts, we use the approach described in (Singh 2014) correct intensity values across each field of view to handle uneven illumination. From (Singh 2014): "We have found that a straightforward approach to retrospective illumination correction (Jones et al., 2006) works well in practice for high-throughput microscopy experiments; here we validate its use. The approach is as follows. The ICF is calculated by averaging all images in an experimental batch (usually, all images for a particular channel from a particular multi-well plate), followed by smoothing using a median filter. Then, each image is corrected by dividing it by the ICF. For the results presented in this paper, we have used a median filter with window size = 500 pixels for the smoothing (Fig. 1)."
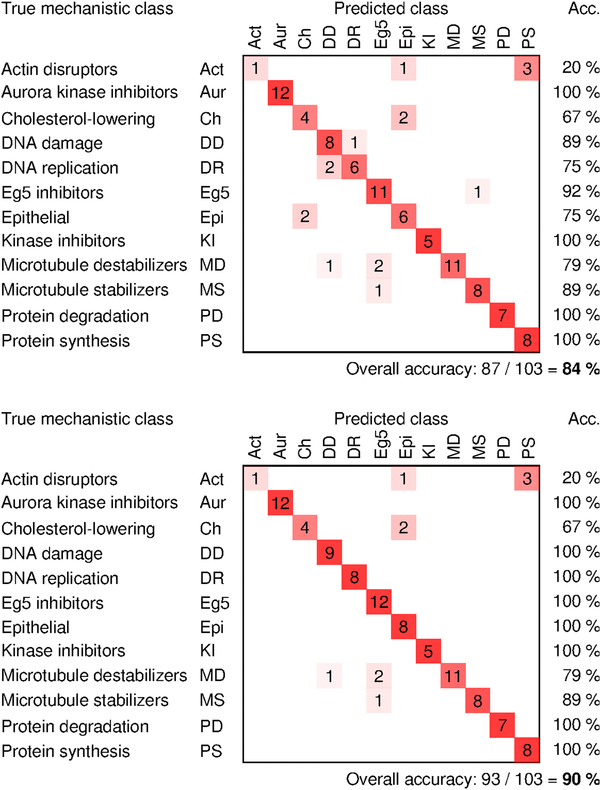
- From (Singh 2014): Illumination correction improves accuracy of mechanism-of-action classification of compounds by 6% even though these images have already been white-referenced using the microscope's software. Confusion matrices show classification accuracy without the proposed method of correction (top) and with correction (bottom). ICFs were computed by plate-wise grouping of images.

Flag/remove images that are affected by technical artifacts or segmentation errors.
We use the workflow described in (Bray 2012 and Bray 2016b) to remove images affected by out-of-focus and debris/saturation issues, using CellProfiler and CellProfiler Analyst. From (Bray 2016b): "The protocol begins with configuring the input and output file locations for the CellProfiler program and constructing a modular QC "pipeline". Image processing modules are selected and placed in the pipeline and the modules’ settings are adjusted appropriately according to the specifics of the HCS project (for example, spatial scales for blur measurements, and the channels used for thresholding; see the section “Configuring the MeasureImageQuality module” below). The pipeline is then run on the images collected in the experiment to assemble a suite of QC measurements, including the image's power log-log slope, textural correlation, percentage of the image occupied by saturated pixels, and the standard deviation of the pixel intensities, among others. These measurements are used within the machine-learning tool packaged with CellProfiler Analyst to automatically classify images as passing or failing QC criteria determined by a classification algorithm. The results can either be written to a database for further review, or the classifier can be used to filter images within a later CellProfiler pipeline so that only those images which pass QC are used for cellular feature extraction. An overview of the workflow is shown in Fig. 2."
Filter out or impute missing values in the data matrix.
Rows with all entries as NA are removed from the data matrix.
Normalize cell features with respect to a reference distribution (e.g. by z-scoring against all DMSO cells on the plate).
We use the approach described in (Singh 2015): "For each feature, the median and median absolute deviation were calculated across all untreated cells within a plate; feature values for all the cells in the plate were then normalized by subtracting the median and dividing by the median absolute deviation (MAD) times 1.4826. Features having MAD = 0 in any plate were excluded."
Transform features as appropriate, e.g. log transform.
We typically do not perform any transformations. We note that other labs do: In (Fischer 2015): "All feature data were subjected to a variance-stabilising transformation (Huber et al., 2002) that interpolates between the logarithm function for large values and a linear function around 0. The transformation reduced heteroskedasticity and improved the fit of the multiplicative model, which was verified by the concentration of residuals around 0."
Systematic noise such as plate effects need to handled.
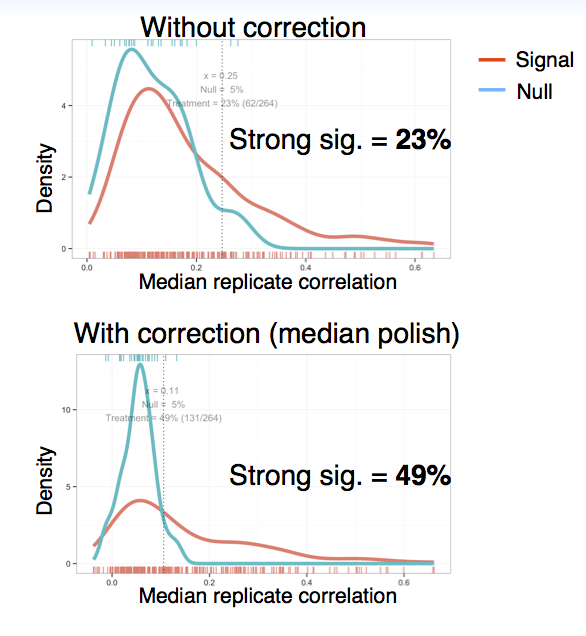
We visualize cell counts and intensity features in heatmap (using the plate layout) and then apply median polish if we observe systematic patterns across the plate. In one of our experiments we found that by applying median polish, the percentage of treatments with a strong signature increased from 23% to 49%:

Select features that are most informative, based on some appropriate criterion, or, perform dimensionality reduction
In (Singh 2015), we used PCA to reduce dimensionality. We later observed that a feature selection approach similar to that described in (Fischer 2015) gave better downstream results. From (Fischer 2015): "We then aimed at selecting an informative, non-redundant subset of these features for further analysis by an automated procedure. First, we eliminated those features that were not sufficiently reproducible between replicates (cor <0.6) (Figure 1C). We then started the feature selection with three manually chosen features based on their interpretability and to facilitate comparability with previous work: number of cells, fraction of mitotic cells and cell area (Horn et al., 2011). Subsequently, for each further feature, we fit a linear regression that modelled the feature's values over all experiments as a function of the already selected features. The residuals of this fit were used to measure new information content not yet covered by the already selected features (Figure 1D). Among candidate features, we selected the one with the maximum correlation coefficient of residuals between two replicates. This procedure was iterated, and in each iteration we computed the fraction of features with positive correlation coefficients. The iteration was stopped when this fraction no longer exceeded 0.5 (Figure 1D). This choice of cut-off was motivated by the fact that for a set of uninformative features, the fraction is expected to be 0.5."
Aggregate single-cell data from each well to create a per-well morphological profile. This is typically done by computing the median across all cells in the well, per feature. Other approaches include methods to first identify sub-populations, then construct a profile by counting the number of cells in each sub-population.
-
We typically use the approach described in (Singh 2015), where, for each of the wells, the median for each feature is computed across the cells in the well.
-
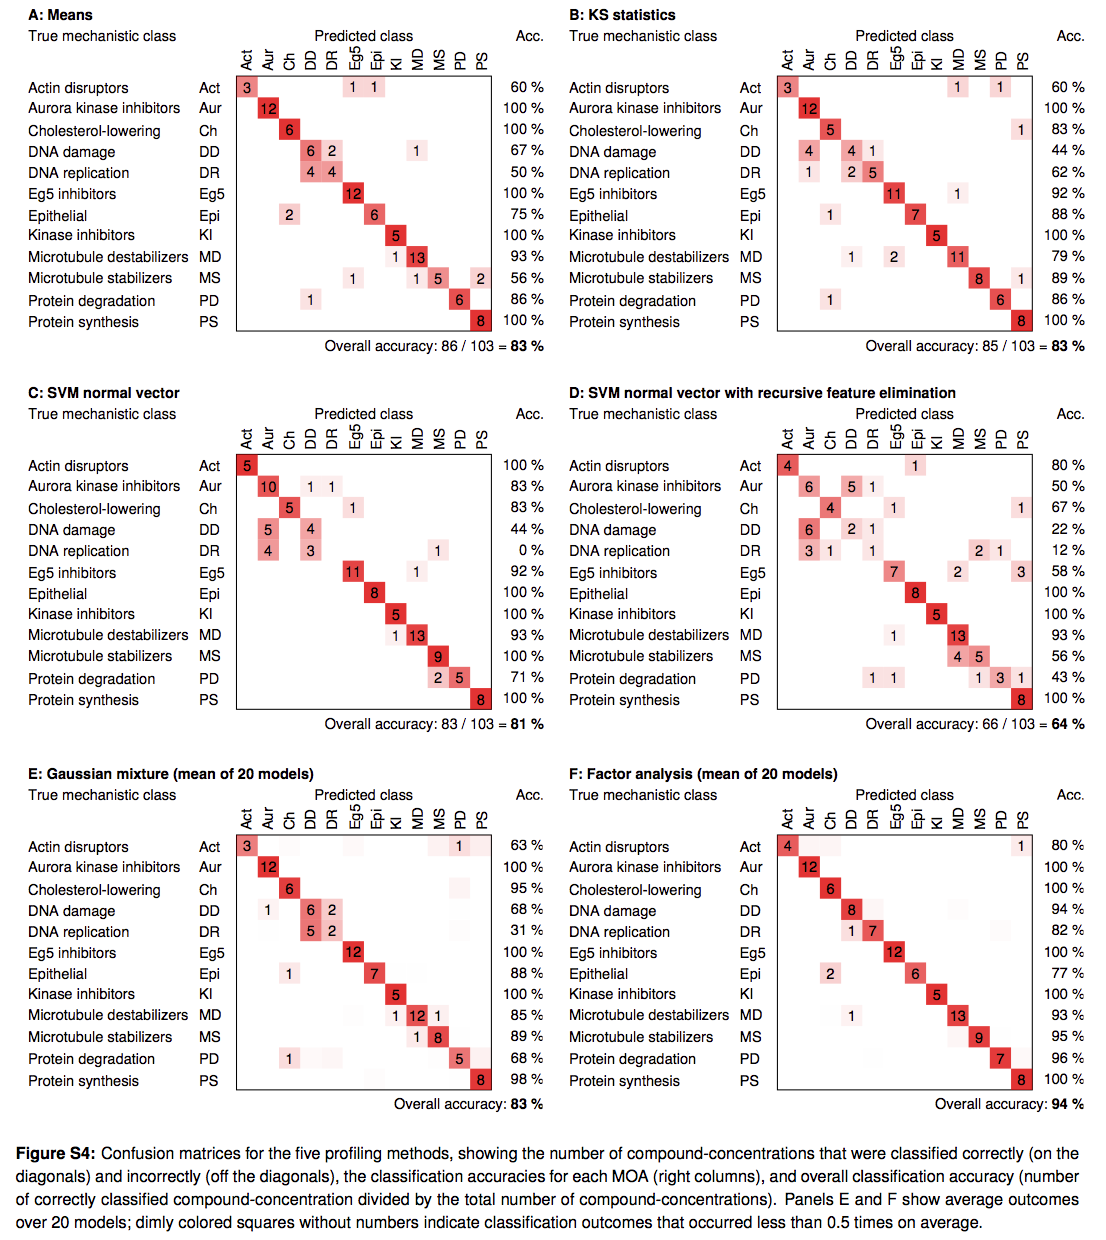
In (Ljosa 2013) compared different approaches of creating profiles from single-cell data, and found that relatively simple methods – that of aggregating per-cell values using mean or median - performed similar to or better than methods that used more sophisticated methods of modeling single cell data to create profiles. From (Ljosa 2013): "Several profiling methods have been proposed, but little is known about their comparative performance, impeding the wider adoption and further development of image-based profiling. We compared these methods by applying them to a widely applicable assay of cultured cells and measuring the ability of each method to predict the MOA of a compendium of drugs. A very simple method that is based on population means performed as well as methods designed to take advantage of the measurements of individual cells. This is surprising because many treatments induced a heterogeneous phenotypic response across the cell population in each sample. Another simple method, which performs factor analysis on the cellular measurements before averaging them, provided substantial improvement and was able to predict MOA correctly for 94% of the treatments in our ground-truth set."
 - We are actively working on alternate methods for creating profiles.
An appropriate similarity metric is crucial to the downstream analysis. Pearson correlation and Euclidean distance are the most common metrics used.
In (Singh 2015), we used Spearman correlation to measure similarity between profiles. We later observed that, across several other experiments, Pearson correlation was more appropriate, based on downstream metrics such a replicate reproducibility and the biological relevance of clusters.
Analysis/visualization performed after creating profiles. E.g. clustering, classification, visualization using 2D embeddings, etc.
- To group perturbations, we typically use hierarchical clustering.
- To identify which perturbations have a distinct profile, we use the following procedure. Assume that each perturbation has
kreplicates. For a given perturbation, we measure the median of the Pearson correlation between all itskreplicates and consider its signature as distinct if this value is greater than a threshold. This threshold is typically the 95th percentile of a null distribution that constructed in the following way: randomly pickkprofiles and compute the median Pearson correlation between them; repeat this process many times to build a null distribution. - We often find that displaying a correlation matrix is very helpful to get a sense of the data structure and identify whether groupings make sense.
- Interpreting what makes a particular sample or cluster distinct from other samples is still often challenging. We use several approaches so far:
- [Bray 2016b] Bray, M-A, Fraser A.N., Hasaka T.P. & Carpenter A.E. Workflow and metrics for image quality control in large-scale high-content screens. J. Biomol. Screen. 17(2):135-143 (2012).
- [Fischer 2015] Fischer, B. et al. A map of directional genetic interactions in a metazoan cell.. Elife 4, (2015).
- [Gustafsdottir 2013] Gustafsdottir, S. M. et al. Multiplex cytological profiling assay to measure diverse cellular states. PLoS One 8, e80999 (2013).
- [Huber 2002] Huber, W., von Heydebreck, A., Sültmann, H., Poustka, A. & Vingron, M. Variance stabilization applied to microarray data calibration and to the quantification of differential expression. Bioinformatics 18, S96–S104 (2002).
- [Ljosa 2013] Ljosa V, Caie PD, Ter Horst R, Sokolnicki KL, Jenkins EL, Daya S, et al. Comparison of methods for image-based profiling of cellular morphological responses to small-molecule treatment. J Biomol Screen. 2013;18: 1321–1329.
- [Singh 2015] Singh, S. et al. Morphological Profiles of RNAi-Induced Gene Knockdown Are Highly Reproducible but Dominated by Seed Effects. PLoS One 10, e0131370 (2015).
- [Singh 2014] Singh S, Bray M-A, Jones TR, Carpenter AE. Pipeline for illumination correction of images for high-throughput microscopy. J Microsc. 2014;256: 231–236.
- [Wawer 2014] Wawer, M. J. et al. Toward performance-diverse small-molecule libraries for cell-based phenotypic screening using multiplexed high-dimensional profiling. Proc. Natl. Acad. Sci. U. S. A. 111, 10911–10916 (2014).
Implementing profiling workflows
- IA-Lab (AstraZeneca Cambridge)
- Bakal (Inst. Cancer Research London)
- Borgeson (Recursion)
- Boutros (German Cancer Research Center)
- Carpenter (Broad Imaging Platform)
- Carragher (U Edinburgh)
- Clemons (Broad Comp. Chem. Bio)
- de Boer (Maastricht U)
- Frey (U Toronto)
- Horvath (Hungarian Acad of Sciences)
- Huber (EMBL Heidelberg)
- Jaensch (Janssen)
- Jaffe (Broad Comp. Proteomics)
- Jones (Harvard)
- Linington (Simon Fraser U)
- Pelkmans (U Zurich)
- Qiu (Georgia Tech)
- Ross (Novartis High Throughput Biol.)
- Rees (Swansea U)
- Subramanian (Broad CMap)
- Sundaramurthy (Nat. Center for Biol. Sciences)