-
Notifications
You must be signed in to change notification settings - Fork 3
Amplitude Frequency Response
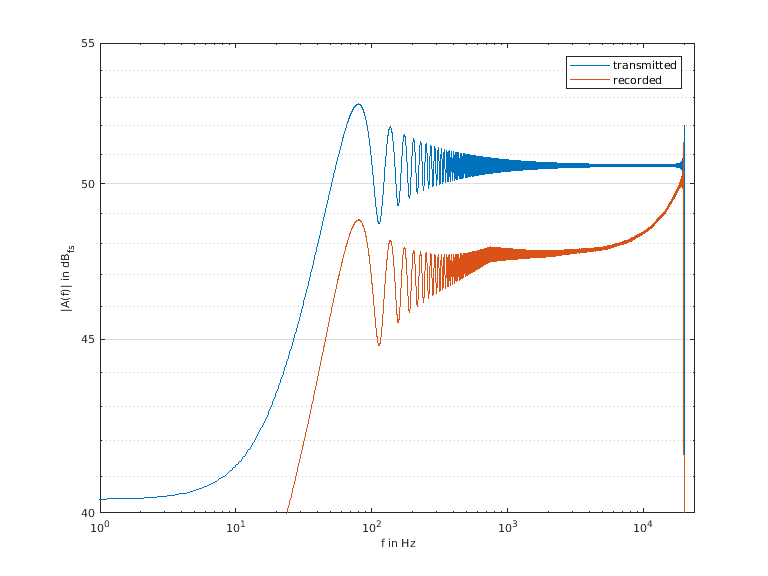
The amplitude frequency response gives an impression of how the system operates at different frequencies and is a good way to characterize a system. We used a matlab script, which you can find under the following link: https://gitlab.com/michael-schindler/audioacidtest. It creates a sweep from 20Hz to 20kHz and the sweep response is measured with the same setup as the THD. As you can see in the plots below, the amplitude frequency response is precise and does not differ much from the input signal. Keep in mind that an audio transmitter is used and also that the output power is at 6.5W.

An explanation for the odd behaviour, in particular the behaviour in low frequencies, of the plot above may be found in
- the audio transmitter specification:
- The bandwidth is specified from 15Hz to 30kHz.
- The recommended setup for input and load resistance were not fulfilled, because the load impedance of the amplifiers was specified to 8Ohms and the input impedance of the audio card was not adjusted.
- the input signal.
- As seen in the blue curve, a chirp has its own characteristic fourier transformated.
- The chirp used was a linear frequency ascending chirp and is now visualized in a double logarithmic scale.
Some of these issues might be avoided in further measurements. For example, the input of the audio card might be connected to an adapted resistance. Even better was to replace the audio transformer completely. As the output amplifier delivers a floating signal, a differential measurement would be required. The disturbing characteristics of the chirp signal may be lowered by using a logarithmic chirp. Even better would be a white gaussian noise as input.